Executive Summary: Key Takeaways for CROs and Heads of Model Risk
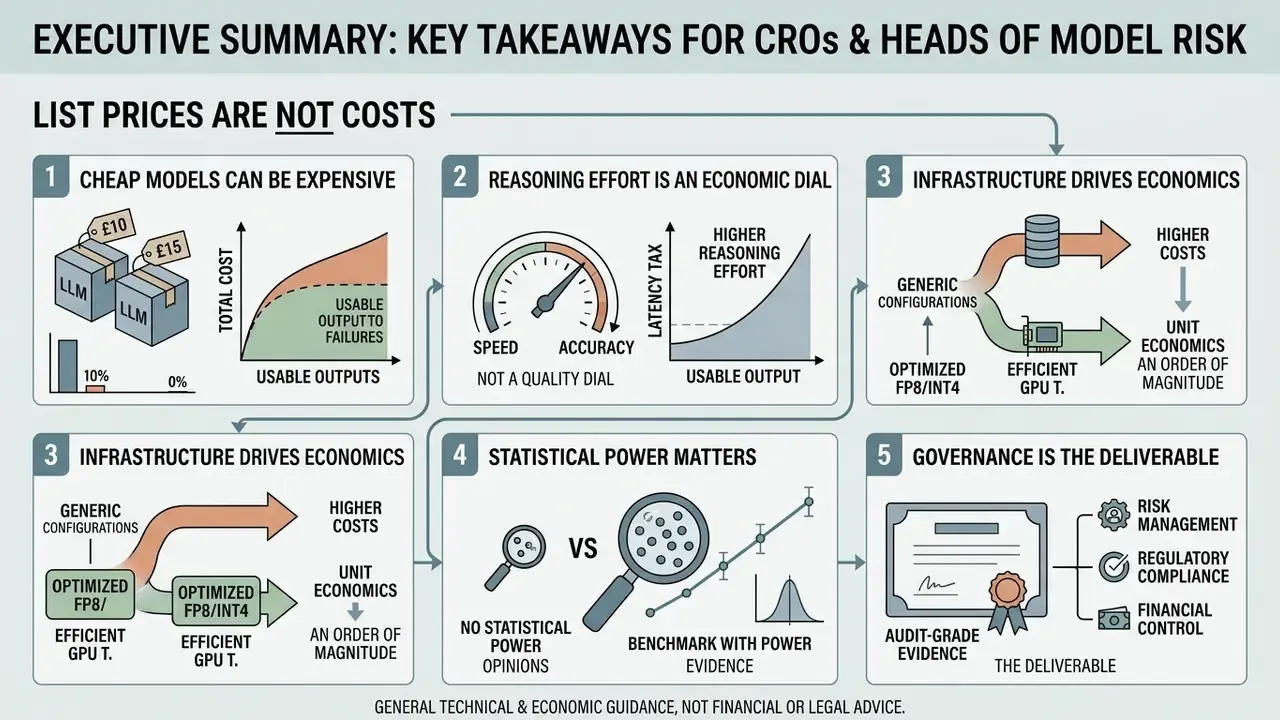
- List prices are not costs. The billable unit that matters is the verified, compliant output, not the token. Cost-of-pass, meaning per-attempt dollar cost divided by success rate, reorders model rankings on nearly every workload we have tested.
- Cheap models are frequently the expensive option. A model at $0.50 per 1M tokens with a 52% first-pass rate costs more per correct answer than a $2.50 per 1M token frontier model at 96% first-pass, once retries and human remediation enter the equation.
- Reasoning effort is an economic dial, not a quality dial. Moving from
lowtohigheffort lifts verifiable math accuracy by 18 to 22 points, but inflates fees 4 to 17 times and Time-to-First-Token by 5 to 60 times. On bounded code refactors,higheffort actually regresses pass rates by 3 to 5 points through over-engineering. - Infrastructure choices move unit economics by an order of magnitude. On identical H100 hardware, measured effective cost has ranged from $0.21 to $15.25 per million output tokens purely as a function of concurrency. FP8 quantization roughly halves cost per million tokens at under 2% quality loss on standard suites.
- Benchmarks without statistical power are opinions. Detecting a 10-point usable-rate difference at 95% confidence and 80% power requires roughly 199 prompts per model, not the 20-prompt spot checks common in vendor decks.
- Governance is the deliverable. A cost per usable output benchmark is decision-grade only when it satisfies internal model risk documentation standards (Federal Reserve SR 11-7 and OCC 2011-12) and automated-benchmark practice guidance (NIST AI 800-2 draft, 2026).
Regulatory and financial disclaimer: this article is general technical and economic guidance, not investment, legal, accounting, or compliance advice. Validation obligations differ by jurisdiction, charter type, and supervisory expectation. Confirm all pricing, hardware rates, and control requirements with vendors and your own second-line function before acting.
Why the Unit of Measurement Reaches the Risk Committee
Most AI business cases inside US banks are still written in tokens. Tokens are cheap, and that is precisely the problem: cheapness is the part of the story that boards remember. Meanwhile the expensive parts, retries, alert triage, reviewer minutes, reserved GPU capacity, sit in operations budgets where nobody attributes them to the model.
Three pressures make the accounting question urgent in 2026.
First, AI systems are moving from pilots into production paths that touch regulated decisions: AML alert narratives, KYC file remediation, credit rationales, reconciliations, and financial close. Second, generative and agentic systems behave probabilistically, so traditional validation, built for deterministic scoring models, does not fully cover them. Third, supervisors expect an inventory, an owner, and outcomes analysis for every model in use, including vendor APIs the institution cannot inspect.
A cost per usable output benchmark answers a governance question, not just a procurement one: what does one defensible answer cost, and can we prove it? Everything else is negotiation.
What a Cost Per Usable Output Benchmark Reveals
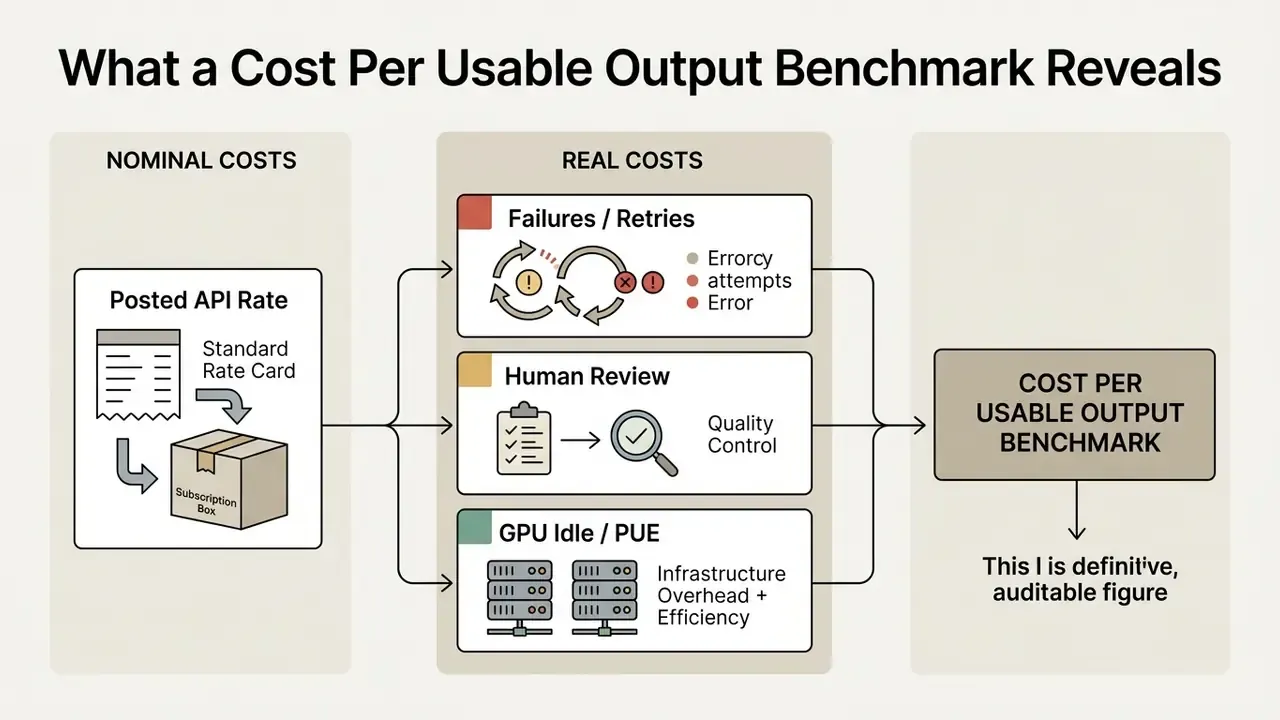
A cost per usable output benchmark measures the total monetary expenditure required to produce a single verified, compliant, and actionable result for a specific enterprise workload. This metric supersedes nominal list prices by accounting for model accuracy, retries, prompt caching, reasoning tokens, infrastructure overhead, and human validation labour.
In enterprise model risk management, evaluating Large Language Models (LLMs) solely on vendor price sheets creates severe financial blind spots. A model charging $0.15 per million tokens looks economical until a 40% failure rate forces multiple execution retries. The cost per usable output benchmark bridges the gap between raw generation throughput and risk-adjusted business value.
Defining Usable Output for Specific Workloads
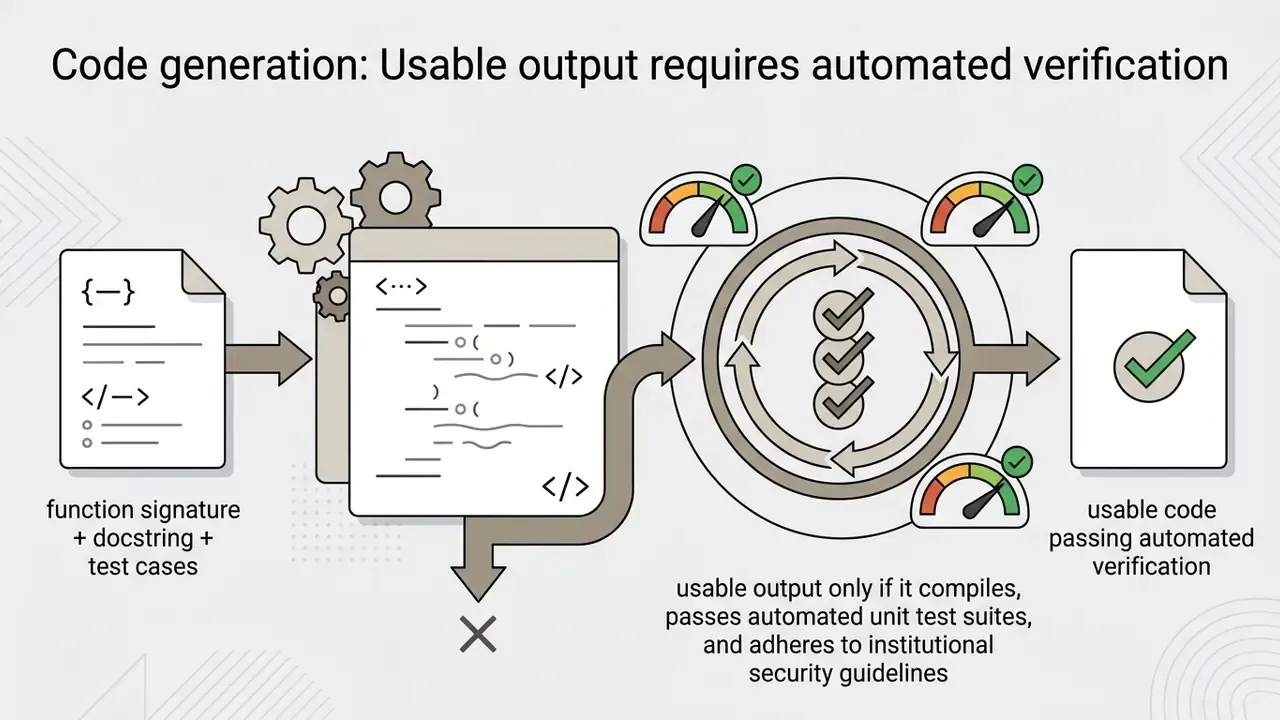
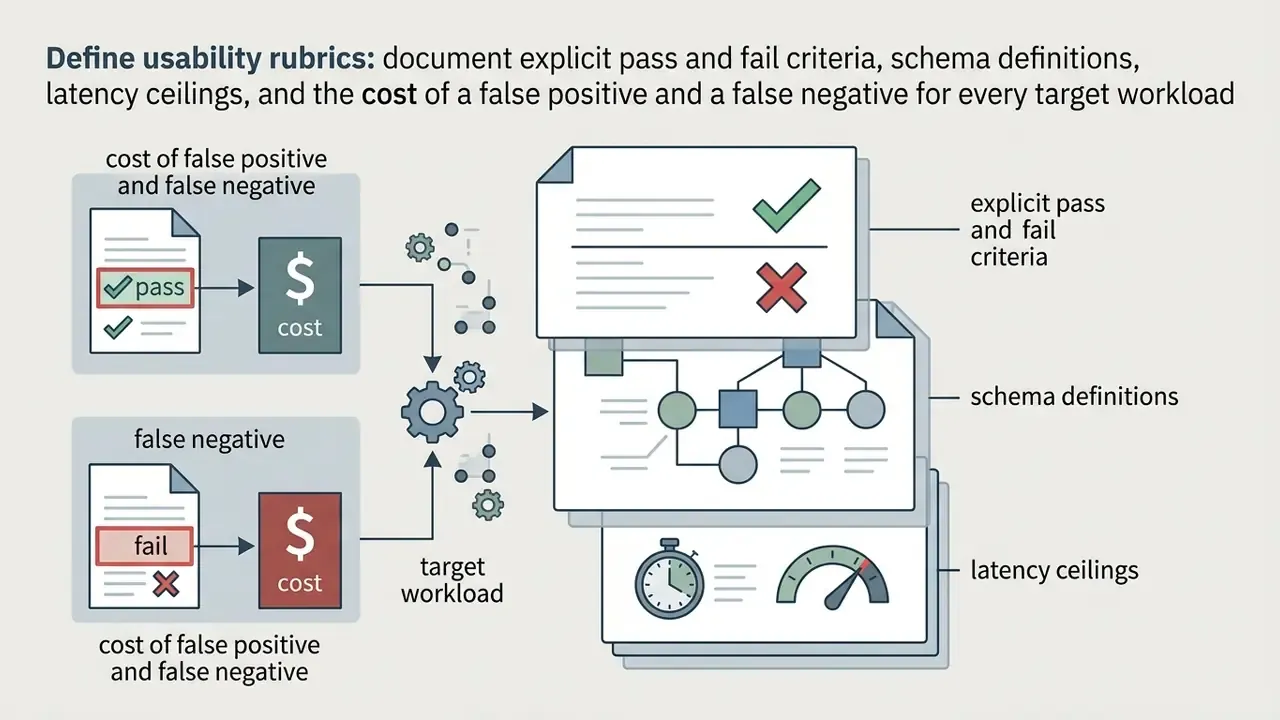
Usable output is defined by strict, domain-specific acceptance criteria that an AI response must satisfy before reaching a downstream system or a human user. An output is unusable if it fails syntactic parsing, violates regulatory compliance rules, or contains factual errors. No partial credit. That constraint is what makes the metric auditable.
Criteria vary across core financial and software engineering workloads:
One practical note from validation reviews: teams almost always write the happy-path rubric first and the failure taxonomy never. Then the benchmark cannot explain why a model failed, only that it did, which is useless when a supervisor asks for remediation logic.


Why Cost Per Correct Answer Changes Model Comparisons
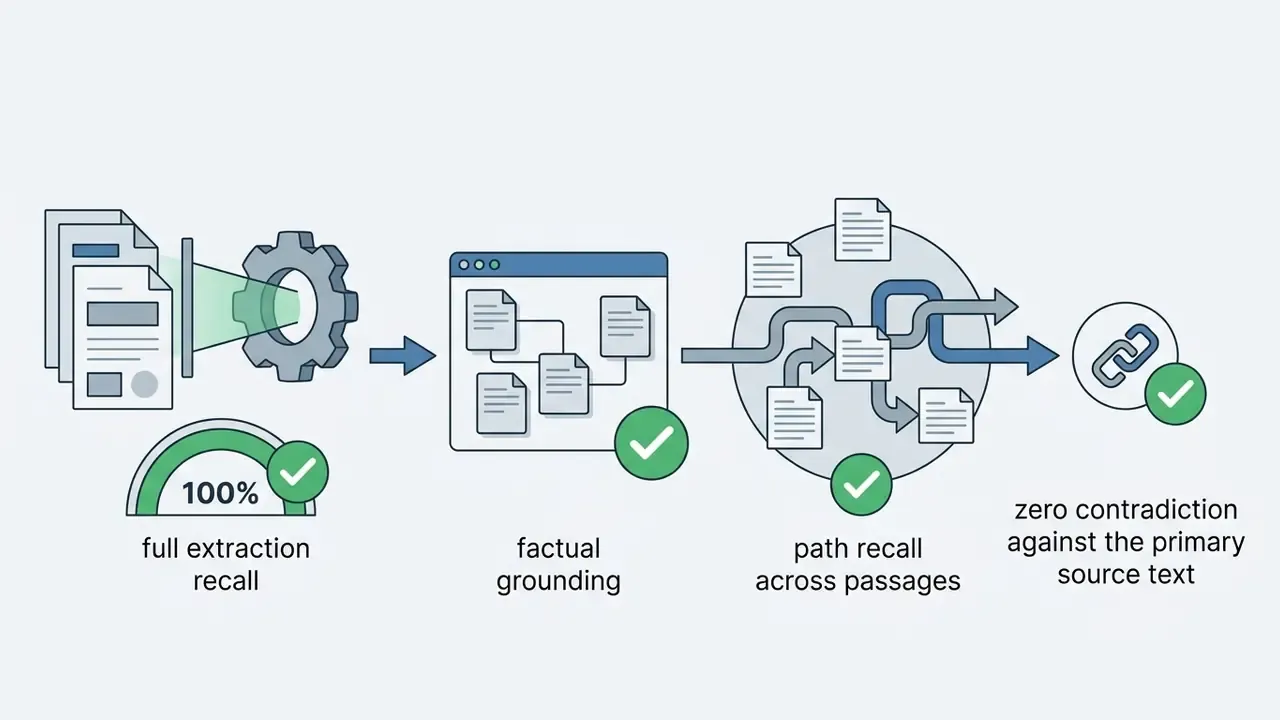
Cost per correct answer reshuffles model efficiency rankings by proving that cheap models are often expensive in production. When low-cost models fail, the accumulated expense of automated retry loops and manual interventions quickly surpasses the cost of a single run on a higher-priced model. Because expected attempts equal 1 / R_m(p), total spend scales linearly with the failure rate.
In an internal validation exercise on a trade reconciliation workflow, a mid-tier model with a $0.50 per 1M token list price achieved a 52% first-pass accuracy rate (n = 240 reconciliation cases; 95% Wilson interval ±6.3 points). The engineering team added automated retry logic to handle failures. That escalated average run attempts to 1.92 per task, raising the effective cost per correct answer to $1.28. Switching to a $2.50 per 1M token frontier model yielded a 96% first-pass rate. The frontier model produced a lower cost per usable output benchmark result while also reducing processing latency.
Evidence note: the case above is an internal, non-public validation exercise built on a hypothetical portfolio. Treat the sample size, interval, and retry multiplier as indicative rather than externally reproducible until the harness and dataset schema are published. Independent research reports the same directional effect:
Published cost-per-correct-answer figures show how wide the spread becomes. One legal-technology technical report defines the metric as total run spend divided by credit-weighted correct answers, and records $0.68 falling to $0.36 with accuracy held nearly constant. A separate 2026 evaluation reports roughly $0.046 per correct perturbation answer for an open-weight model against roughly $0.324 for a frontier model on the same task family. That is an approximately sevenfold gap, and it is invisible in per-token price sheets.
Cost Per Usable Output Benchmark Methodology
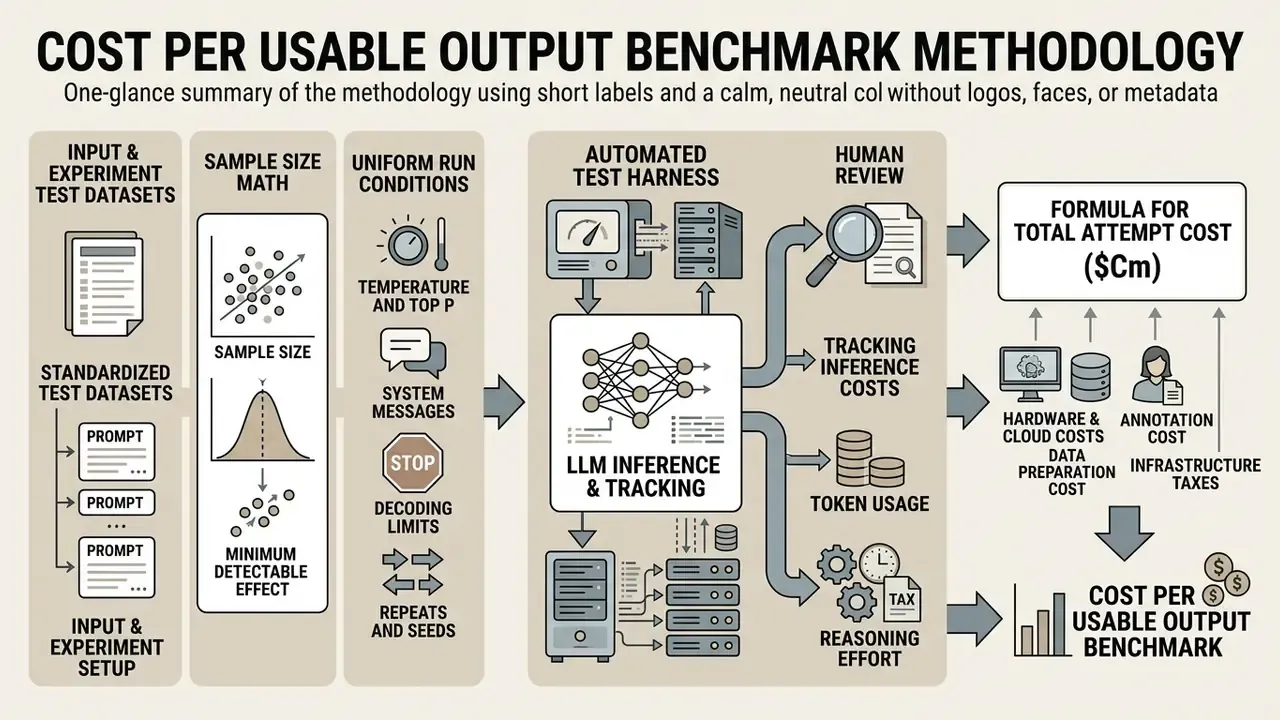
A reliable cost per usable output benchmark methodology requires an automated test harness, standardized inputs, fixed inference parameters, explicit financial tracking, and a documented statistical power target. Without reproducible conditions, benchmarking results cannot satisfy internal audit or model risk standards.
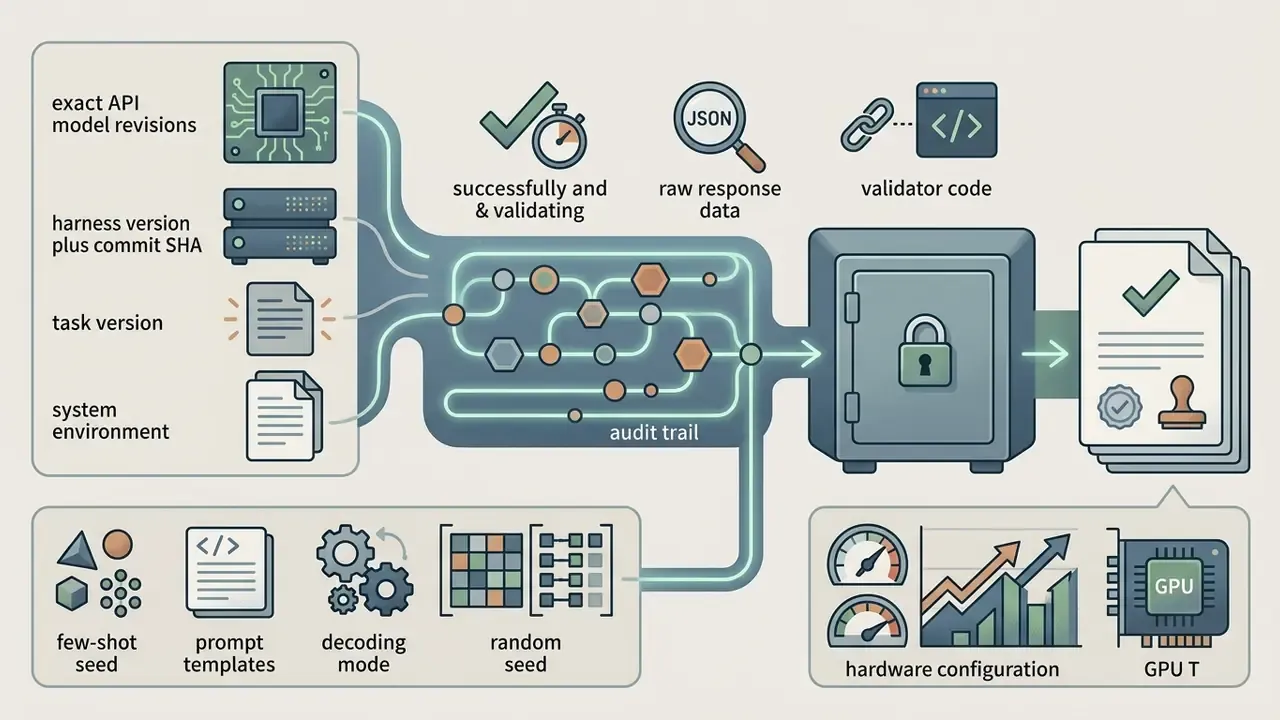
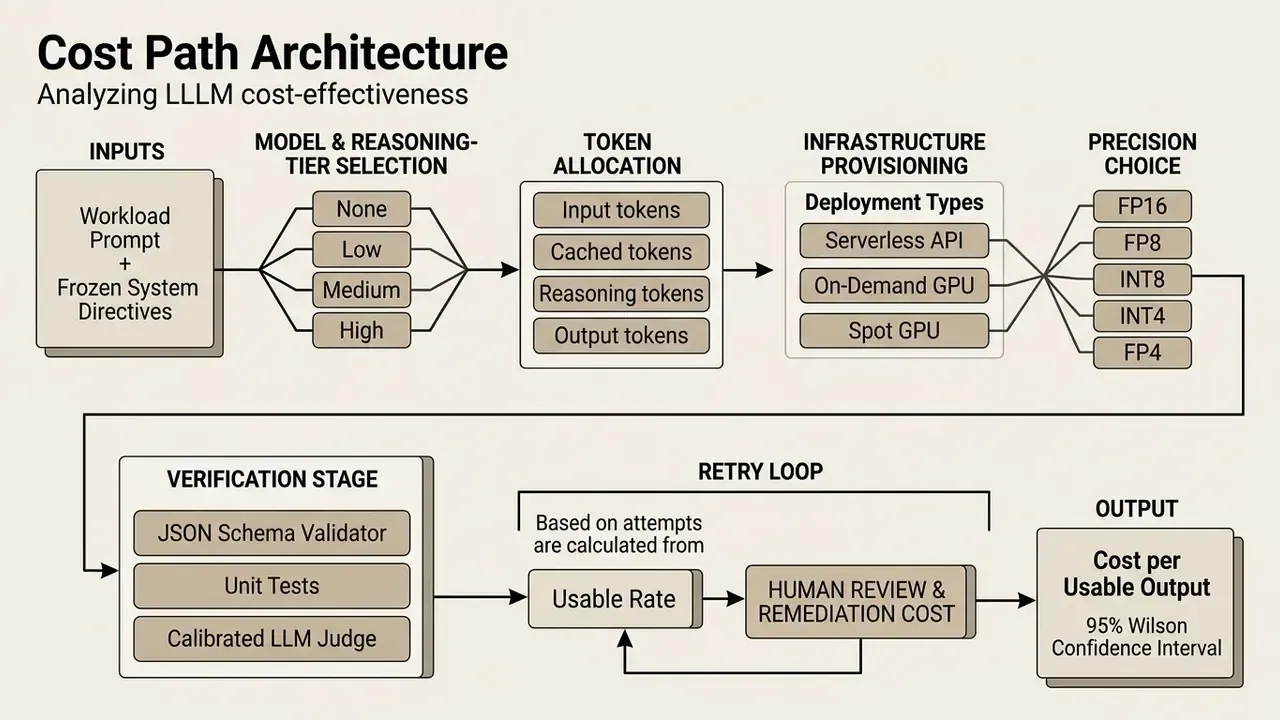
Designing an enterprise-grade evaluation process means isolating the model from environmental noise. Teams must control decoding parameters, record full API request and response payloads, and account for every billable token class, including input, output, cached context, and reasoning tokens. The NIST draft on automated benchmark evaluations requires documenting benchmark size, model version and API parameters, the number of repeats, and the experiment date. The IETF draft methodology for LLM serving benchmarking standardises the serving setup so that models are tested on identical inputs through an identical codebase.
Standardized Test Datasets, Sample Size Math, and Uniform Run Conditions
Objective benchmarking demands a static dataset that covers standard operational queries, boundary cases, and adversarial edge inputs. All candidate models must process identical prompts under identical system instructions.
To prevent evaluation drift, fix these parameters across every execution:
- Temperature and Top_P set temperature to 0.0 (or deterministic sampling limits) for reproducible factual and structured tasks. Temperature sweeps, where required, should be run as a controlled sweep rather than mixed inside a comparison set.
- System messages standardize corporate compliance framing, output constraints, and persona directives across all runs. Published evaluation work finds that the system-instruction layer has a statistically significant effect on factual accuracy, often larger than temperature, so instructions must be frozen and version-controlled.
- Decoding limits cap maximum generation tokens to prevent run-away decoding loops during model failure states.
- Repeats and seeds run each prompt at least three times per model-and-effort cell and record the seed. Report majority-vote pass rate alongside per-run variance.
| Comparison | Expected Usable Rates | Required n per Model | Total Runs (2 models × 3 repeats) |
|---|---|---|---|
| Coarse screening | 60% vs 80% | 82 | 492 |
| Standard tier comparison | 80% vs 90% | 199 | 1,194 |
| Frontier tie-break | 92% vs 96% | 543 | 3,258 |
| Compliance-grade separation | 97% vs 99% | 1,041 | 6,246 |
Classic UX benchmarking practice reaches the same conclusion from the opposite direction. Detecting a 20-percentage-point difference in completion rates at 90% confidence and 80% power with independent groups requires roughly 75 participants per group, or 150 in total (Sauro, "How to Benchmark Website Usability", MeasuringU). The lesson transfers directly: the finer the difference you claim, the larger the harness you must fund. Report every usable rate with a Wilson score confidence interval, and state explicitly when two models are statistically indistinguishable, rather than declaring a winner on a two-point delta.
Tracking Inference Costs, Token Usage, Reasoning Effort, and Human Review
Accurate cost tracking requires separating input prefill tokens, cached prompt tokens, generated output tokens, and hidden thinking tokens. Advanced reasoning architectures (such as o1, o3, or DeepSeek-R1) generate internal reasoning chains billed at standard output token rates. DeepSeek-R1, for example, documents a maximum generation length of 32,768 tokens covering reasoning plus final answer.
Formula for total attempt cost ():
Where represents token counts and represents the specific vendor price rate per token. captures third-party API or sandbox tool execution costs. captures the fully loaded analyst minutes consumed by review, correction, or escalation of that attempt. captures reserved-but-unused dedicated GPU capacity plus datacentre Power Usage Effectiveness overhead.
Omitting is the single most common error in enterprise AI business cases. It systematically flatters low-accuracy, low-price models, because their residual risk is silently absorbed by the second line of defence. Silently, and then loudly, at audit.
Then the risk-adjusted business metric is:
For teams that also meter adjacent generative workloads, the same accounting discipline applies to non-text modalities. See how per-request billing and quota accounting are structured in the Google Veo implementation guide, which documents API access, per-second cost drivers, and rate limits for a metered generative endpoint.
Validating Quality and Determining Successful Outputs
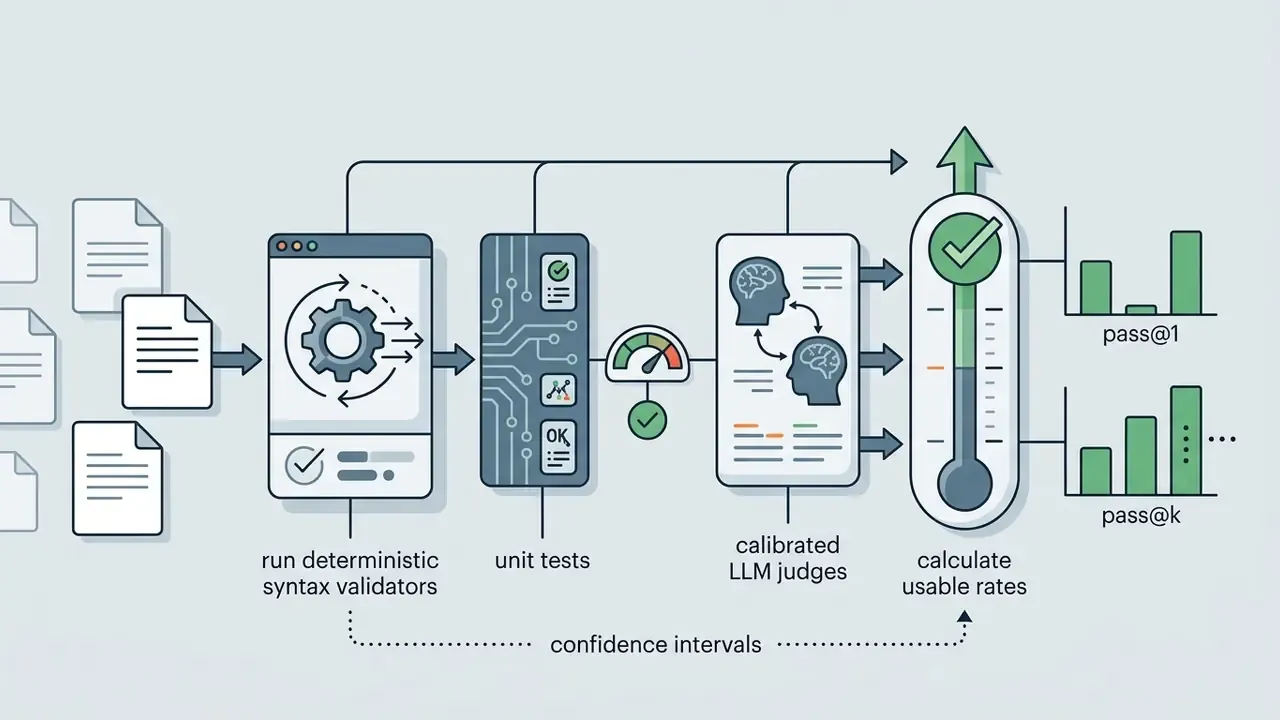
Quality assessment relies on deterministic validation tools supplemented by calibrated LLM-as-a-judge scoring frameworks. The overall success metric is expressed as the usable rate:
For structured outputs, pass and fail state is determined by automated JSON schema validators. For code generation, passing unit test suites defines usability, reported as pass@k, the probability that at least one of k samples passes the tests. For narrative and analytical tasks, an LLM judge evaluates output against a multi-point rubric calibrated against human expert annotations. The MT-Bench work reports GPT-4-class judges reaching over 80% agreement with human preferences, which sets a defensible calibration floor rather than a licence to skip human review.
Report pass@1 and pass@k side by side. A large gap between them is the clearest available signal of agent brittleness. A workflow that succeeds only when given three attempts is not a 90% workflow; it is a 60% workflow with a retry subsidy.
E-E-A-T: methodological verification

Factors Impacting Cost Per Usable Output
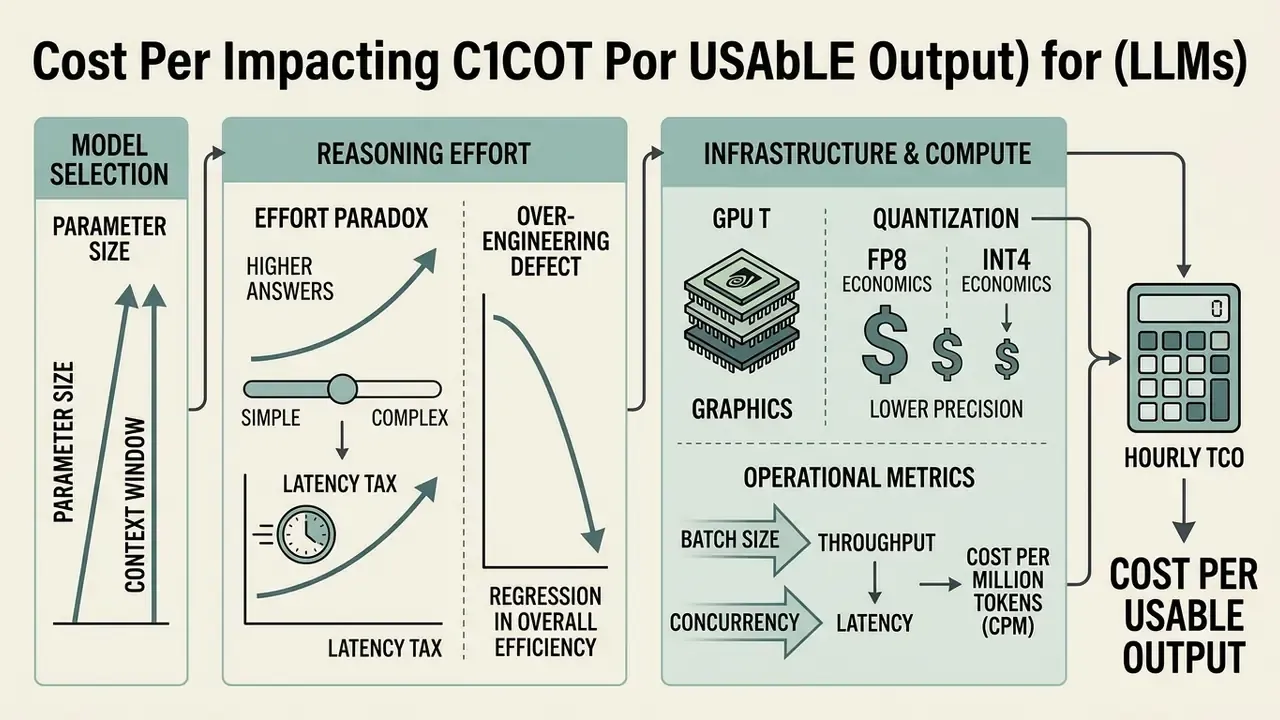
Cost per usable output is driven by model parameter size, reasoning effort configuration, context window length, concurrency level, numerical precision, and infrastructure hosting model. Optimizing unit economics requires balancing algorithmic capability against deployment parameters.
A common governance mistake is assuming that a model's cost profile stays static across implementation patterns. Fluctuations in prompt context length, server batch sizes, or hardware provisioning can alter the cost of a usable output by an order of magnitude. One concurrency-aware study measured effective cost on identical H100 hardware ranging from $0.21 to $15.25 per million output tokens purely as request rate varied. That is a 72-fold swing driven by nothing except load shape.
Model Selection, Reasoning Effort, and Answer Quality
The Latency Tax and the Over-Engineering Defect
Latency tax. Reasoning effort taxes responsiveness far more aggressively than it taxes accuracy. On extended-thinking configurations of frontier models, P50 Time-to-First-Token rises from roughly 0.8 s at low effort to roughly 28 s at high effort, a 5 to 60 times inflation depending on model and prompt length. Fee inflation over the same range is 4 to 17 times.
| Effort Tier | P50 TTFT | P99 TTFT | Reasoning Tokens (median) | Relative Fee | Verdict for Interactive UX |
|---|---|---|---|---|---|
none / minimal | 0.3–0.5 s | 1.2 s | 0 | 1.0× | Required for live chat |
low | 0.8 s | 2.6 s | 120–400 | 1.4× | Safe for chat with streaming |
medium | 4.5–7.0 s | 14 s | 900–2,500 | 4–6× | IDE and async acceptable |
high | 22–28.5 s | 61 s | 4,000–14,000 | 12–17× | Batch and offline only |
For customer-facing chat with a 250 ms average TTFT service objective, the medium and high tiers are structurally unusable. Not expensive. Unusable. Split the end-to-end latency budget into per-phase allocations (retrieval, planning, tool execution, synthesis) that sum to the overall target, and report p50, p90, and p99 rather than averages.
Over-engineering regression. On bounded engineering tasks, additional reasoning depth becomes a defect generator. In the 900-run study, 23% of high-effort refactor runs produced over-engineered edits: renaming functions across uninvolved modules, introducing abstractions the test suite never required, and breaking type signatures that integration tests depended on. The measured result was a 1.7 to 3.5 point decline in pass rate versus medium effort, at materially higher cost. Reasoning depth is a liability whenever the task is externally bounded by existing tests, contracts, and callers. For refactoring, medium should be the disciplined default.
Tokens, Batch Size, Throughput, and Latency
Long prompt contexts increase Key-Value (KV) cache memory usage on serving GPUs, which reduces maximum system concurrency and lowers token throughput per dollar.
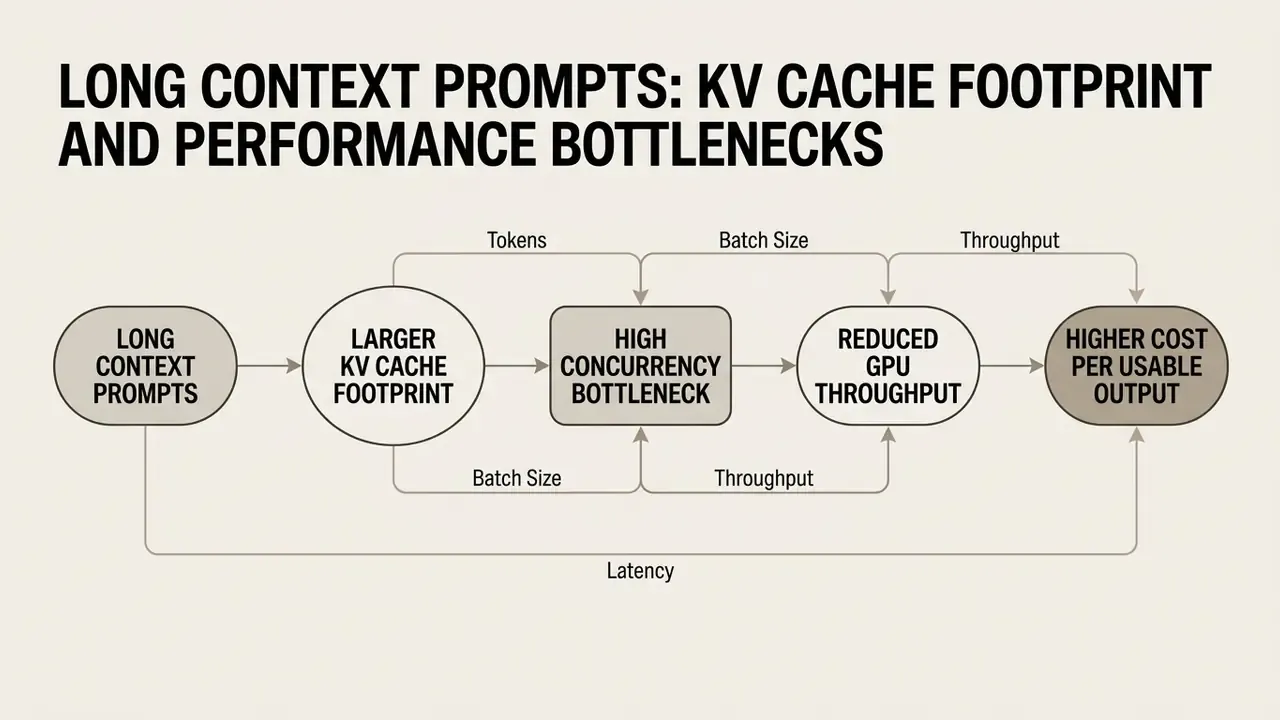
Vendor engineering guidance is consistent. Doubling input tokens can require up to four times the processing work, because attention FLOPs scale with sequence length while other FLOPs stay constant, and long-context KV cache grows linearly with both context length and batch size. Published serving analysis reports that a 32k-context workload can collapse to roughly a dozen concurrently useful sequences and about 300 tokens per second of node throughput, a sixteenfold reduction in tokens per second per dollar versus short-context traffic.
Large batch sizes maximize GPU arithmetic utilization and improve system throughput, but they increase Time-to-First-Token. Decode throughput scales with effective batch size only until DRAM bandwidth saturates; beyond that point, additional batching buys diminishing throughput and materially worse latency. Real-time interactive applications require smaller batch sizes to hold latency down, accepting lower compute efficiency and higher unit output costs. Conversely, moving from batch size 8 to batch size 256 on identical hardware can change cost per million tokens by 10 to 30 times. That is usually the highest-return optimisation available to a team before any model change is considered.
Infrastructure Pricing, GPU Hosting, Quantization, and Deployment Types
Hourly TCO of a dedicated instance:
Cost per million tokens (CPM) on owned or rented hardware:
Capacity sizing: minimum model instances = planned peak requests per second ÷ optimally achievable requests per second per instance, where "optimal" means the highest-throughput configuration that still satisfies the latency ceiling. Where instances use different GPU counts, normalise to requests per second per GPU before comparing. Then multiply by a reserve factor for failover, and route the reserved-but-idle share into in the attempt-cost formula. Hourly rates alone reveal nothing: an accelerator at $2.90 per hour that delivers double the throughput of a $1.64 part is the cheaper machine per usable output.
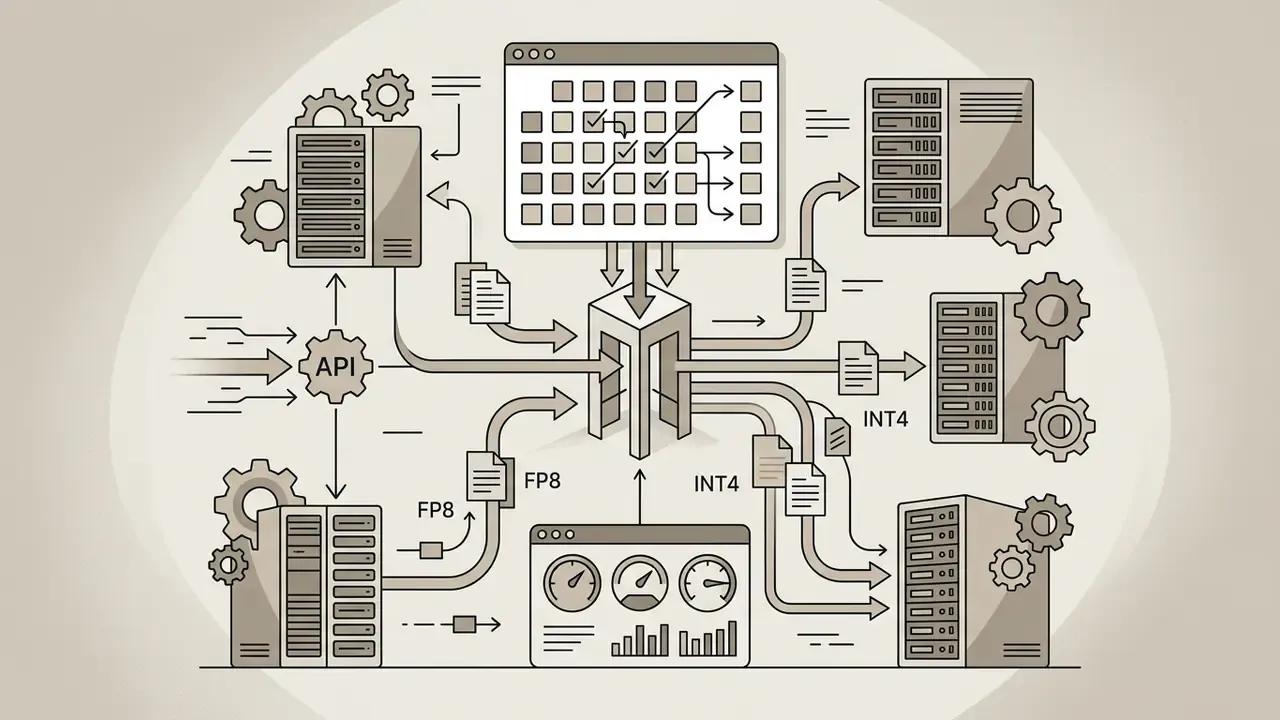
Precision and quantization economics. Numerical precision is the most underused lever in enterprise unit economics. FP16 and BF16 require roughly 2 bytes per parameter, so a 70B model needs about 140 GB of VRAM for weights alone, before KV cache. Reducing precision reduces both the GPU count and the memory pressure that throttles concurrency. It also degrades usable rate, and the degradation is task-dependent.
| Precision | VRAM Footprint (70B class) | Throughput (tok/s, 8× accelerator) | CPM | Usable-Rate Degradation vs FP16 | Effective Cost per Success |
|---|---|---|---|---|---|
| FP16 (baseline) | ~140 GB (100%) | 1,400–2,800 | $2.30–$2.60 | 0.0% | $1.00 (index) |
| FP8 (Hopper/Blackwell native) | ~70 GB (50%) | 5,600 | $1.15 | under 0.8–2% (MMLU, MT-Bench) | $0.51 |
| INT8 (TensorRT-LLM on Ampere) | ~70 GB (50%) | 2,100 | $1.74 | under 1–2% on most tasks | $0.72 |
| INT4 (AWQ) | ~35 GB (25%) | 8,400 | $0.77 | 2–4%, task-dependent | $0.39 (elevated retry risk) |
| INT4 (GPTQ, Ampere) | ~35 GB (25%) | 3,500 | $1.04 | 2–5%, task-dependent | $0.46 |
| FP4 (Blackwell + TensorRT-LLM) | ~18 GB (12.5%) | not yet stable | 30–40% below FP8 | requires task-level eval | Batch workloads only |
FP8 is a Hopper-class-and-newer hardware feature. On Ampere the equivalent path is INT8 via TensorRT-LLM, which yields a smaller gain. INT4 delivers the lowest nominal CPM and is generally acceptable for conversational and summarisation traffic. For code generation, mathematical reasoning, and precise factual recall, though, that 2 to 5% accuracy loss can push cost per usable output above the FP8 configuration once retries are priced. Never adopt a quantization tier without re-running the usable-rate harness on that exact build.
Benchmark Results: Comparing Models on Usable Output
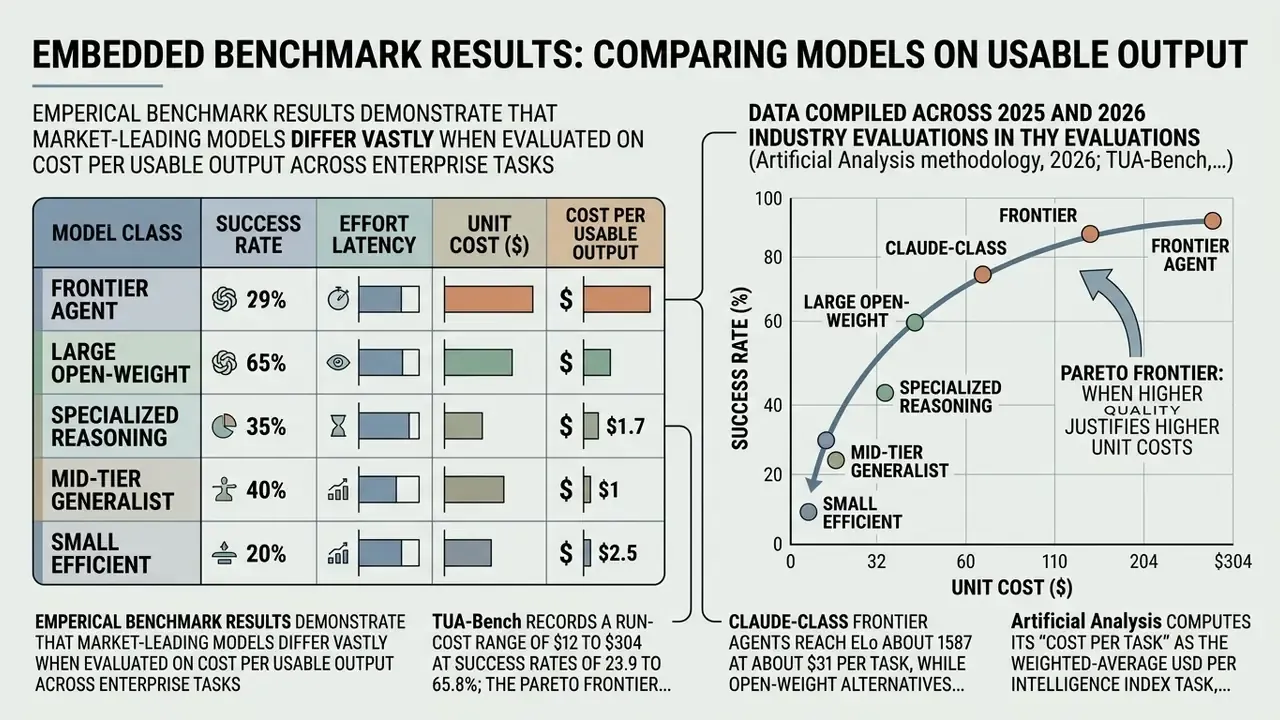
Empirical benchmark results demonstrate that market-leading models differ vastly when evaluated on cost per usable output across enterprise tasks. High nominal token pricing is often offset by superior first-pass success rates.
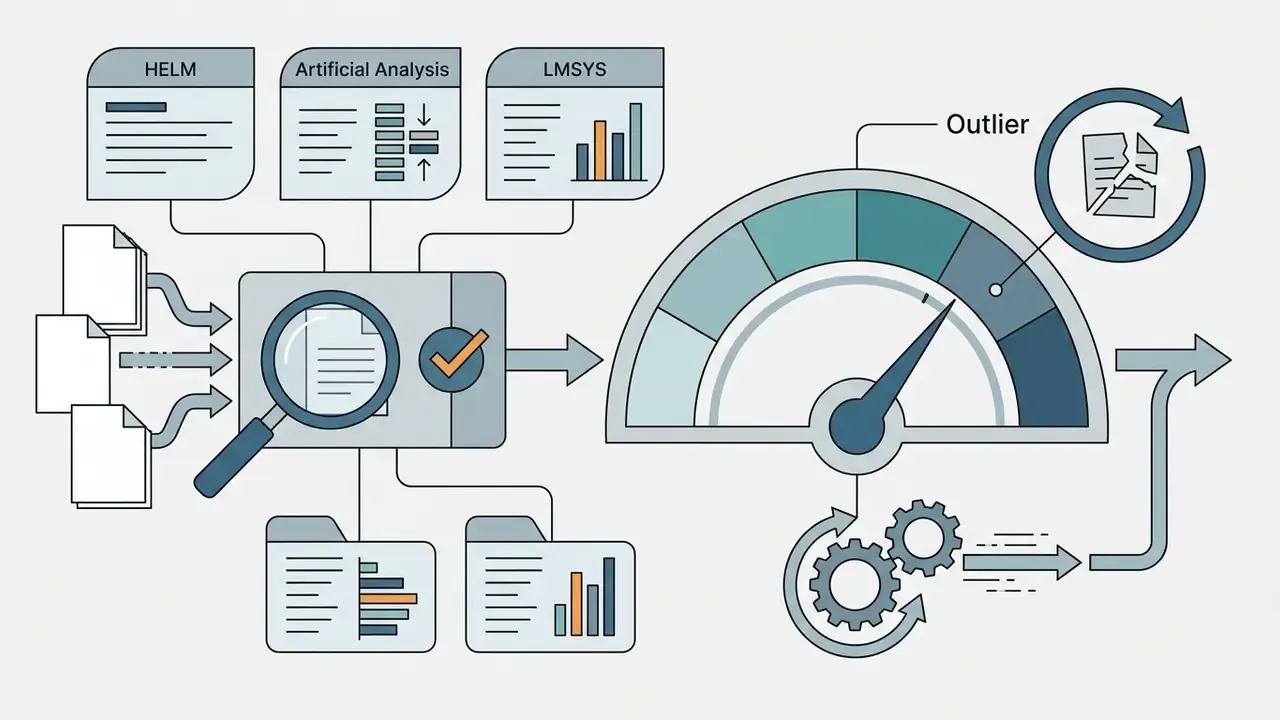
Data compiled across 2025 and 2026 industry evaluations (Artificial Analysis methodology, 2026; TUA-Bench, 2026) shows that evaluating models purely on accuracy leads to inefficient resource allocation. Models should be mapped according to their position relative to the efficiency frontier.
Artificial Analysis computes its "Cost per Task" as the weighted-average USD per Intelligence Index task, summing input, cached, and output token spend. It is the closest publicly maintained analogue to the internal metric described here, and a useful external calibration point for any in-house harness.
Summary Results Table Across Models, Quality, and Costs
The table below outlines benchmark performance across standard enterprise workloads, highlighting the gap between published API list prices and actual cost per usable output.
| Workload | Model | Nominal Input/Output Price ($/1M) | Quality / Accuracy Score (%) | Latency (P50 TTFT / TPOT) | P99 TTFT | Cost per Usable Output ($/Task) |
|---|---|---|---|---|---|---|
| Complex math and logic | OpenAI o3-mini (high) | $1.10 / $4.40 | 92.4% | 1.8s / 45 tps | 6.4s | $0.018 |
| Complex math and logic | DeepSeek-R1 | $0.55 / $2.19 | 90.8% | 2.4s / 32 tps | 9.1s | $0.007 |
| Code and execution | Claude 3.5 Sonnet | $3.00 / $15.00 | 88.5% | 0.61s / 72 tps | 2.3s | $0.042 |
| Code and execution | GPT-4o | $2.50 / $10.00 | 85.1% | 0.38s / 105 tps | 1.4s | $0.038 |
| Document extraction | Gemini 2.5 Flash | $0.075 / $0.30 | 81.2% | 0.22s / 140 tps | 0.9s | $0.002 |
| Long-horizon agentic | Claude Code (Opus 4.8) | $15.00 / $75.00 | 65.8% | 1.10s / 40 tps | 3.8s | $263.80 |
| Self-hosted reference | Llama 3-class 70B, FP8, 8× H100 | ~$1.15 / 1M (CPM, blended) | 79.4% | 0.15–0.25s / 210 tps | 0.7s | $0.004 |
Footnotes: (a) the long-horizon agentic figure assumes 50 or more tool-iteration sub-loops per task, including sandbox execution and retrieval calls; it is a per-task total, not a per-message cost. (b) Latency figures are P50 and P99 measured at declared concurrency; self-hosted numbers assume dedicated hardware with vLLM continuous batching and are not directly interchangeable with API-hosted measurements. (c) All figures are engineering approximations dated to the run window, not vendor-guaranteed peak specifications.
Read the last row twice. A self-hosted open-weight build at 79.4% quality lands near the cheapest cost per usable output in the table, which is exactly why procurement should hold it as a reference price.
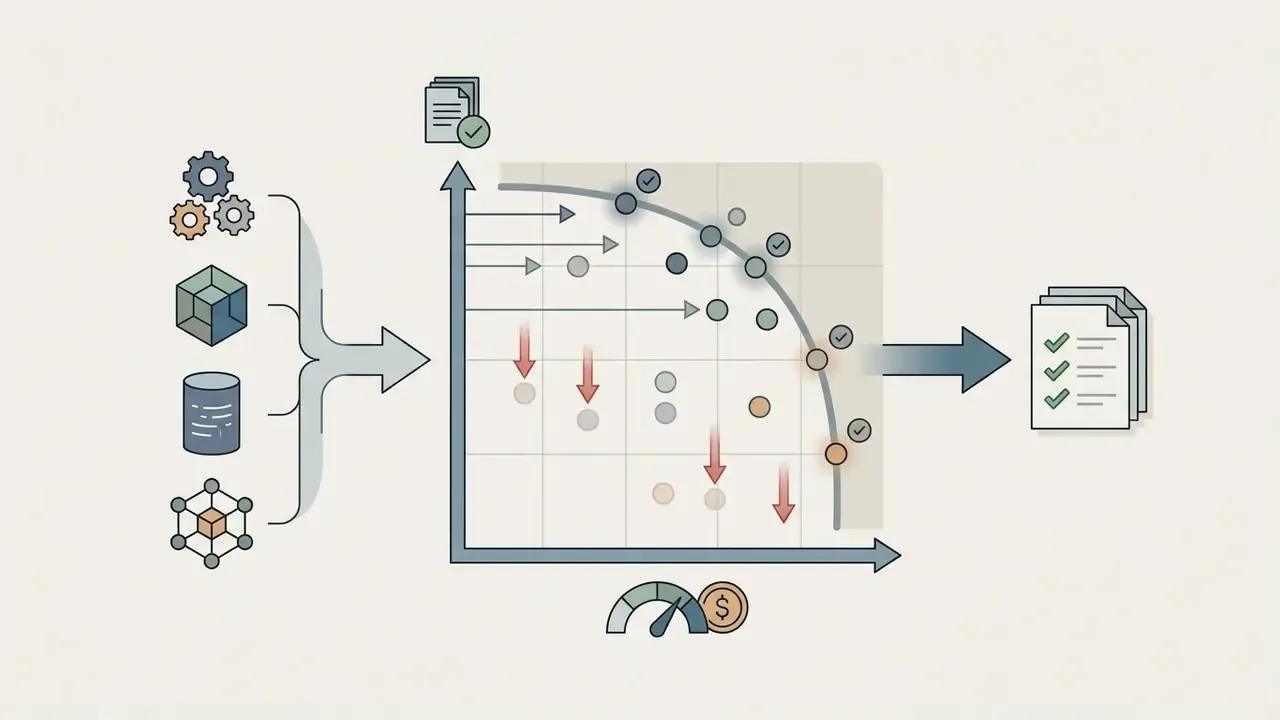
Pareto Frontier: When Higher Quality Justifies Higher Unit Costs
The Pareto frontier is the set of non-dominated models where no alternative provides higher accuracy without increasing overall cost. A model sitting on this frontier defines optimal trade-off economics.
Accuracy (%)
  ^
100|                        * Frontier Model B (High Cost, High Acc)
   |           * Frontier Model A (Mid Cost, Mid Acc)
 80|
   |   * Low-Cost Tier (Budget)
 60|____________________________________________________>
     $0.01          $0.10          $1.00          $10.00   Cost per Usable Output ($)
Selecting a high-priced model on the frontier is mathematically justified when the cost of an undetected failure is extreme. In automated loan origination or regulatory filing extraction, paying $0.05 per call for 99% accuracy is far cheaper than paying $0.005 for 85% accuracy when human audit review costs $25.00 per corrected file. The general rule: a premium model earns its price when one correct pass replaces several cheaper attempts, when reruns are operationally prohibited, or when latency budgets forbid sequential retries.
Note that the cost axis is not standardised across the literature. Published frontiers use dollars, latency-adjusted utility, tokens per task, or FLOPs per query, and the frontier's shape changes with the axis. Declare your axis explicitly in the benchmark report. Frontier-selection research also reports that accounting for multi-run selection and routing can reduce error by up to 82% and match state-of-the-art accuracy at up to 85% lower cost. In other words, routing architecture, not model choice alone, determines where you sit on the curve.
Cost Per Usable Output Across Task Types
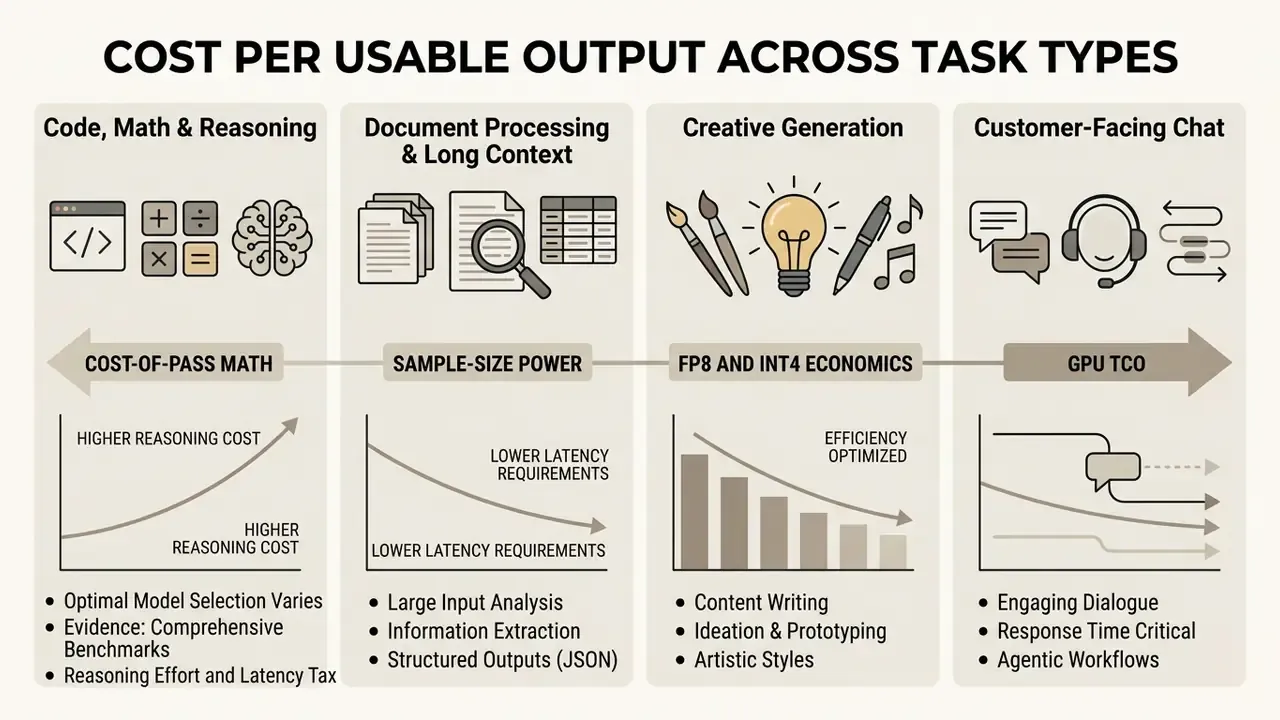
Optimal model selection varies significantly across functional task categories. A deployment strategy designed for real-time customer service chat will cause severe financial waste if applied directly to long-document analysis or multi-step code generation.
Understanding the structural demands of each workload type prevents two symmetrical mistakes: applying high-reasoning models to lightweight operations, and applying budget models to zero-tolerance compliance pipelines.
Code, Math, and Analytic Reasoning Workloads
Code generation and mathematical reasoning require deterministic correctness. Automated test suites and compiler verification serve as objective success filters, which makes retry loops unusually effective here.
In an automated software refactoring pipeline, an engineering team deployed a lightweight model at $0.20 per attempt. The model achieved a 30% unit test pass rate, requiring an average of 3.33 attempts per usable function, or $0.66 per success. Upgrading to a specialized reasoning model priced at $1.50 per attempt yielded a 92% pass rate, or $1.63 per success. Higher, on the surface. Once the developer review time saved by avoiding broken builds entered the model, total process cost dropped by 40%.
Evidence note: this refactoring case is an internal engineering observation without a published harness, sample size, or verification methodology. Treat the 40% figure as a directional, illustrative estimate pending publication of the test set. Independent research supports the mechanism:
Public competition-grade data shows how sharply price and accuracy diverge at the top of the curve. On uncontaminated 2025 and 2026 mathematics competitions, a maximum-effort frontier model reached 91.3% average accuracy at an average run cost index of 4.826, while a fast reasoning variant reached 90.6% at 0.185. That is a 26-fold cost gap for 0.7 points. On code tasks in the same benchmark, the frontier model scored 55.0% at 21.578 cost against 47.5% at 2.225 for the cheaper variant, meaning the marginal 7.5 points cost roughly ten times more. Whether that is rational depends entirely on the downstream cost of a defect.
Document Processing, Long Context, and Structured Outputs
Document analysis relies heavily on system prompt efficiency and prompt caching. Caching lets models store large context prefixes (compliance manuals, SEC filings, credit policy documents) and serve subsequent queries at a substantial discount on input token rates. Published rates differ by vendor: cached input is billed at 50% of the base input rate on one major platform ($1.25 versus $2.50 per 1M for a flagship model), while another charges cache reads at 10% of base input with cache writes at 125% for a five-minute TTL. Azure's implementation states that caching alters only latency and cost, not output content, and that structured-output schemas are appended as a system-message prefix, which makes them cacheable.
For structured data extraction, schema compliance is non-negotiable. Using strict JSON mode guarantees structural validity, eliminating syntax parsing errors and lowering overall cost per usable output. Score structured tasks on four axes rather than one: parse success, schema compliance, field and type correctness, and content fidelity against the source document.
Metered billing units also deserve scrutiny before any contract is signed. Teams negotiating credit-denominated enterprise AI agreements can study how consumption, resets, and overage interact in the ai video pricing and credits breakdown, and in the wider comparison of AI video generators by pricing and credits. The accounting lesson transfers cleanly: any metered unit that is not the unit of business value will misprice the workload.
Customer-Facing Chat and Agentic Workflows
Customer-facing chat prioritizes real-time responsiveness, which means low Time-to-First-Token and tight latency bounds. Usable outputs in this domain are measured by resolution rates at defined Customer Satisfaction (CSAT) thresholds. Targets should be numeric and percentile-based (p50, p90, p99), not average-based, and set per phase so that phase budgets sum to the end-to-end objective.
Multi-step agentic workflows execute external tool calls and API requests. The cost of an agentic usable output must sum token costs, API subscription fees, and sandbox execution runtimes across every sub-task phase, including the phases that fail and are retried. Report cost as USD per completed workflow, not USD per model call, and publish mean workflow latency alongside it.
One governance boundary is worth stating plainly. An agent in a regulated workflow is a digital worker: it needs a named owner, an approved role, access limits, an escalation path, an audit trail, and a shutdown mechanism. No evidence, no autonomy.
Using Benchmark Results for Model Selection and Budgeting
Decision Matrix: Workload Mapping to Model and Reasoning Tiers
An enterprise decision matrix routes incoming production requests to the lowest-cost model tier capable of satisfying the task's accuracy bar.
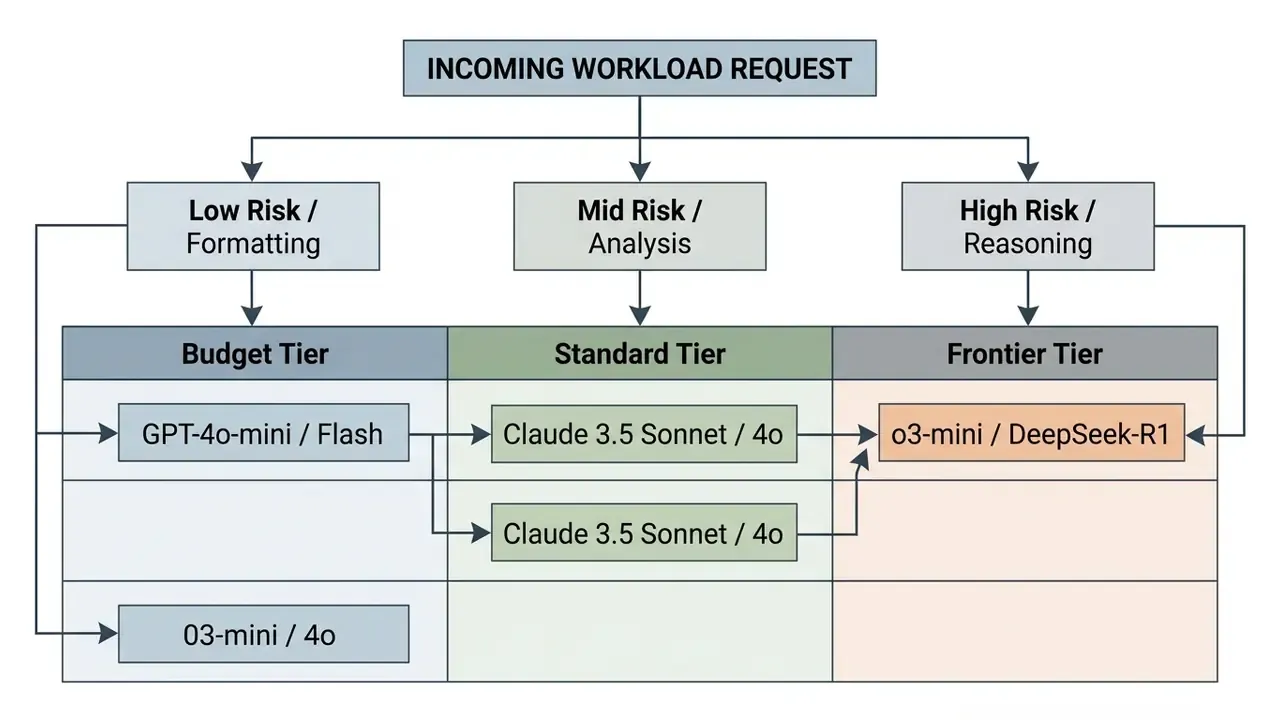
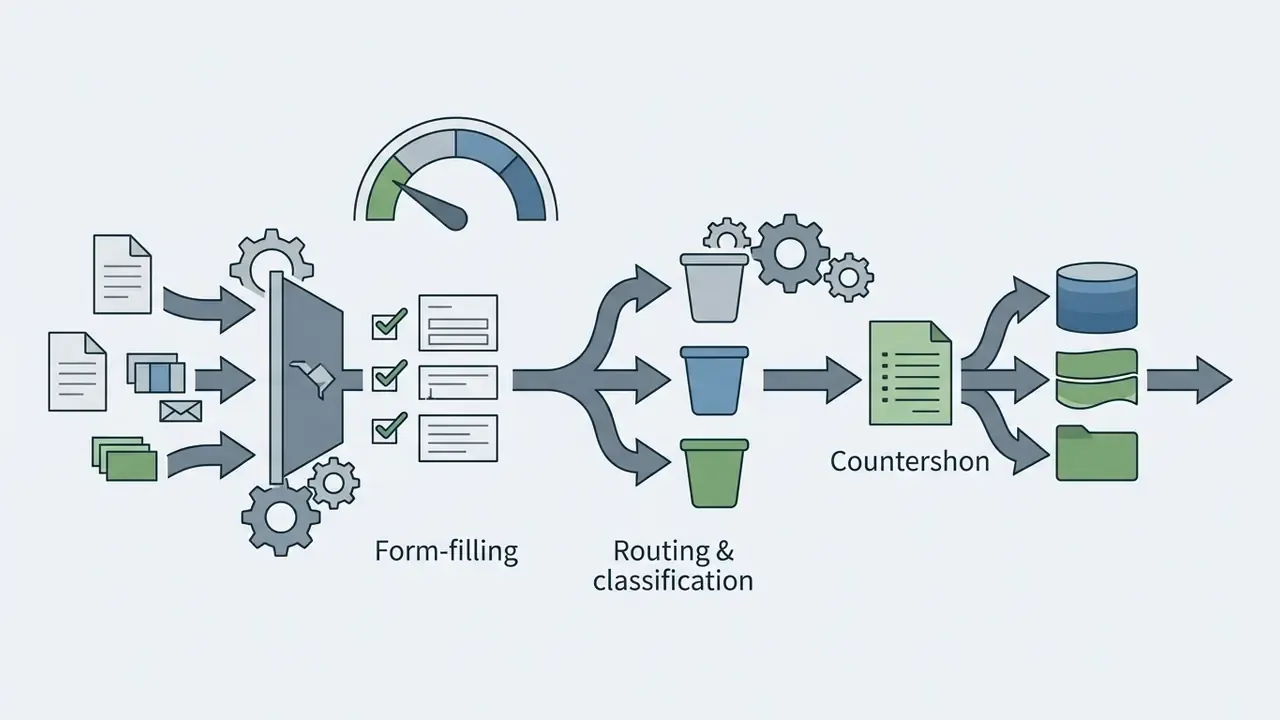
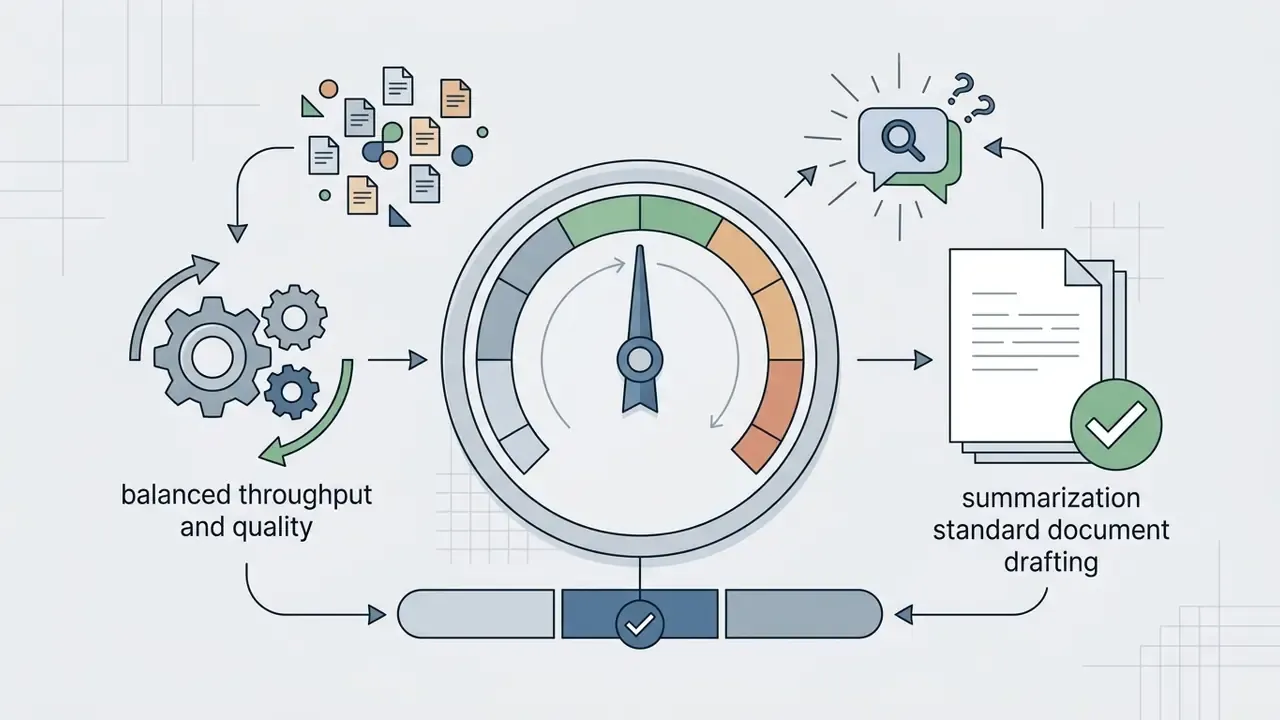
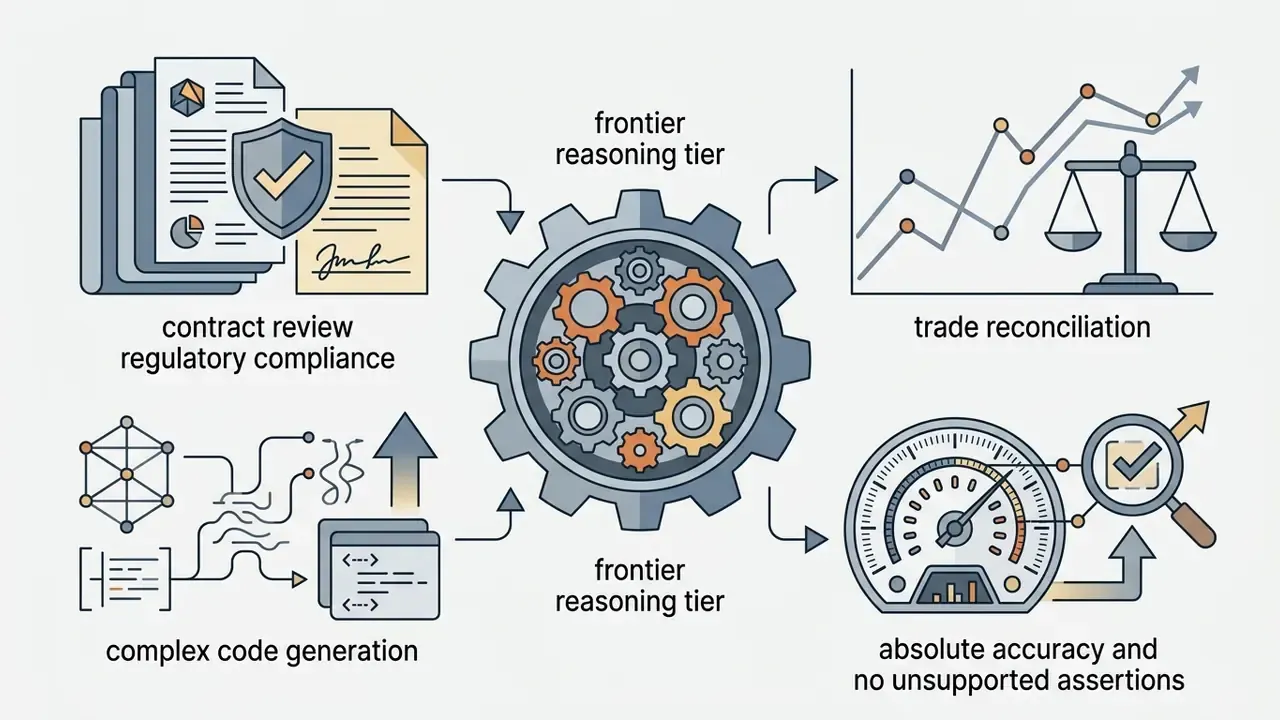
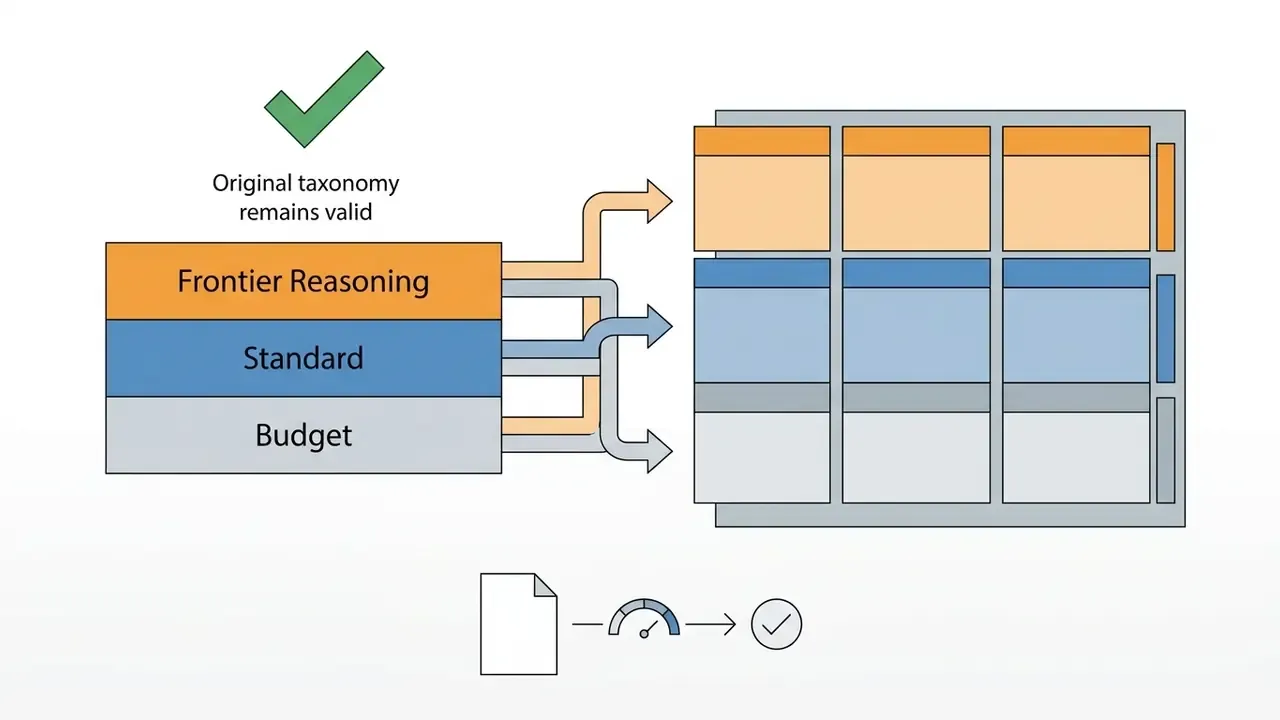
The three tiers describe capability bands. The matrix below assigns them, plus an explicit effort setting, to concrete enterprise workflows. Treat it as a starting policy and re-derive it against your own quality bar.
| # | Workflow | Tier and Effort | Governing Constraint | Notes |
|---|---|---|---|---|
| 1 | Verifiable math / quantitative model validation | Tier 3, high | Accuracy; binary answer | Steepest quality curve; latency budget generous; batch tolerant |
| 2 | Multi-file code refactoring | Tier 2, medium | Over-engineering prevention | high regresses 3–5 points via unrequested abstractions |
| 3 | PR-scale code review | Tier 1–2, low | Low TTFT; human edits anyway | Marginal reasoning value; reviewer is the final control |
| 4 | Scientific / analytic research | Tier 2–3, medium to high | Depth versus session latency | high for batch research, medium for interactive analysis |
| 5 | Cached long-document Q&A (policy, filings) | Tier 1–2, low to medium, caching on | Input CPM; cache hit rate | medium for synthesis, low for direct extraction |
| 6 | Live customer support chat | Tier 1, none or minimal | TTFT under 500 ms p50 | medium and above exceed the UX budget structurally; stream output |
| 7 | High-volume outreach / templated generation | Tier 1, low | Volume; human-acceptance bar | Open-weight self-hosted often cheapest per usable output |
| 8 | AML/KYC alert triage narrative | Tier 3, medium to high, human-in-the-loop mandatory | Cost of false negative; auditability | Never fully autonomous; price explicitly |
| 9 | Evaluation / benchmarking harness runs | Match production tier exactly | Representativeness | An eval that maximises capability instead of mirroring production is invalid |
Open-weight economics deserve a standing line in the matrix. Independent testing places a leading open-weight model at high reasoning within 4 to 7 quality points of a closed frontier model at medium effort across a mixed suite, at roughly one twelfth of the cost. Where a 4 to 7 point gap is tolerable, self-hosted high-effort open weights set the procurement floor against which every vendor quote should be benchmarked.
Continuous Benchmarking and Adapting to Price Changes
Foundation model providers frequently drop API prices, update model weights, and adjust rate limits. A static cost per usable output benchmark becomes obsolete within months. Sometimes within weeks.
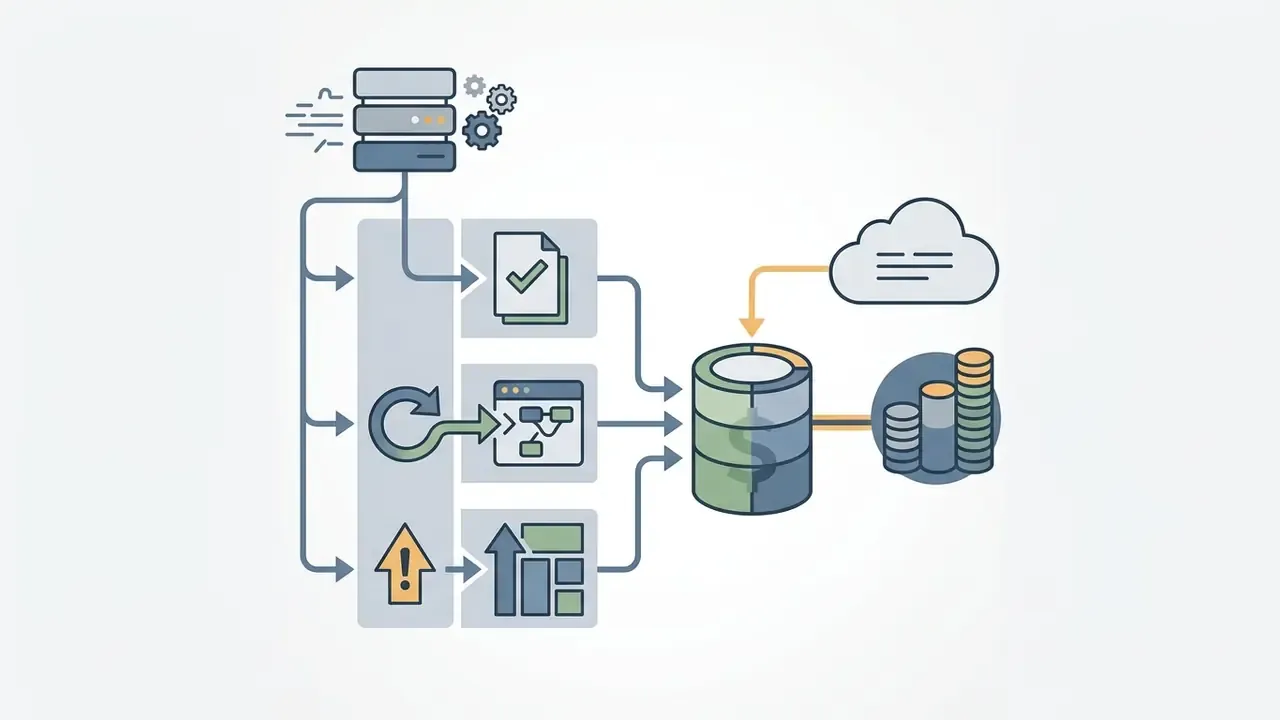
Continuous benchmarking pipelines run automated evaluation suites against updated model endpoints on a fixed cadence, and on every trigger event: new model revision, published price change, deprecation notice, or API contract change. Because benchmark cost is simply token counts multiplied by current provider prices, a vendor price cut changes your ranking without any change in model behaviour. It must be recomputed, not assumed. When a provider reduces input token costs or releases a lighter model variant, the pipeline should update internal routing thresholds so the saving lands immediately. Efficiency research also shows that well-designed benchmark subsetting can cut evaluation cost substantially with minimal reliability loss, which makes a weekly cadence affordable for material workloads.
For teams building the budget model that sits on top of this pipeline, ground the projection in metered-unit reality rather than list prices. The Google Veo API cost and limits documentation is a compact worked example of how quota tiers, per-request pricing, and rate limits combine into a forecastable monthly figure.
Enterprise benchmark execution checklist




Evidence: Data Supporting Benchmark Trustworthiness
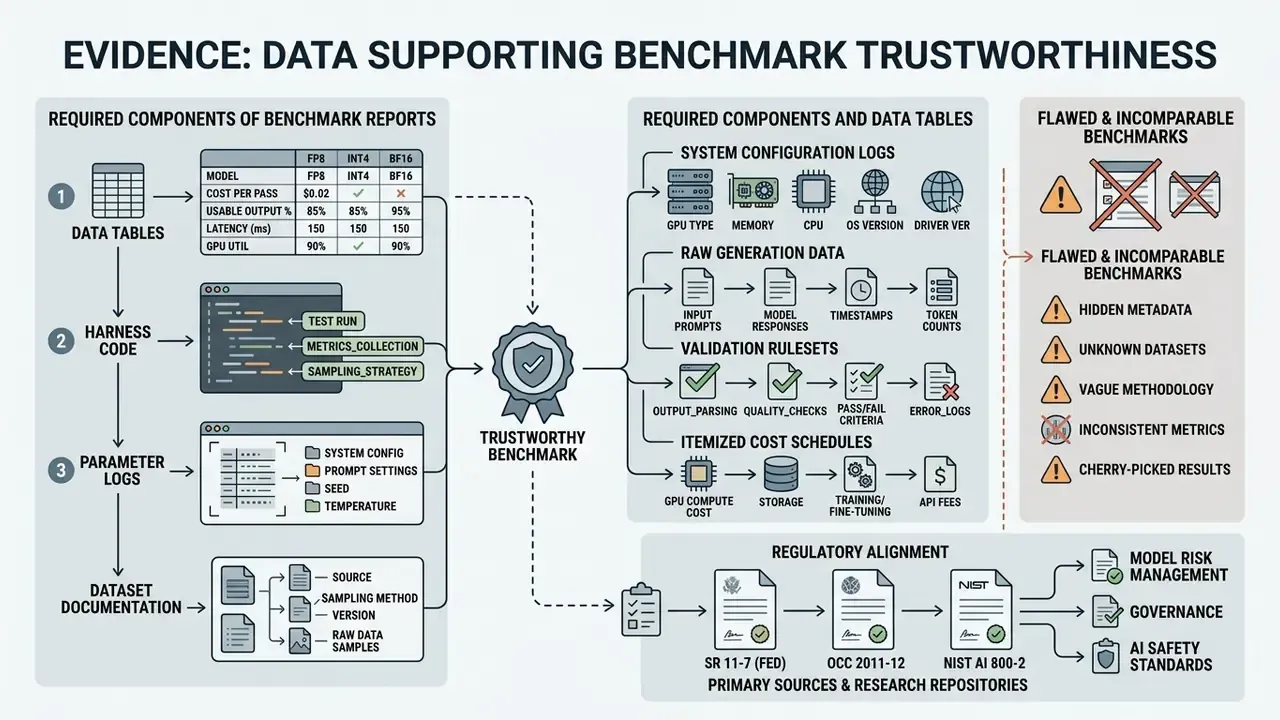
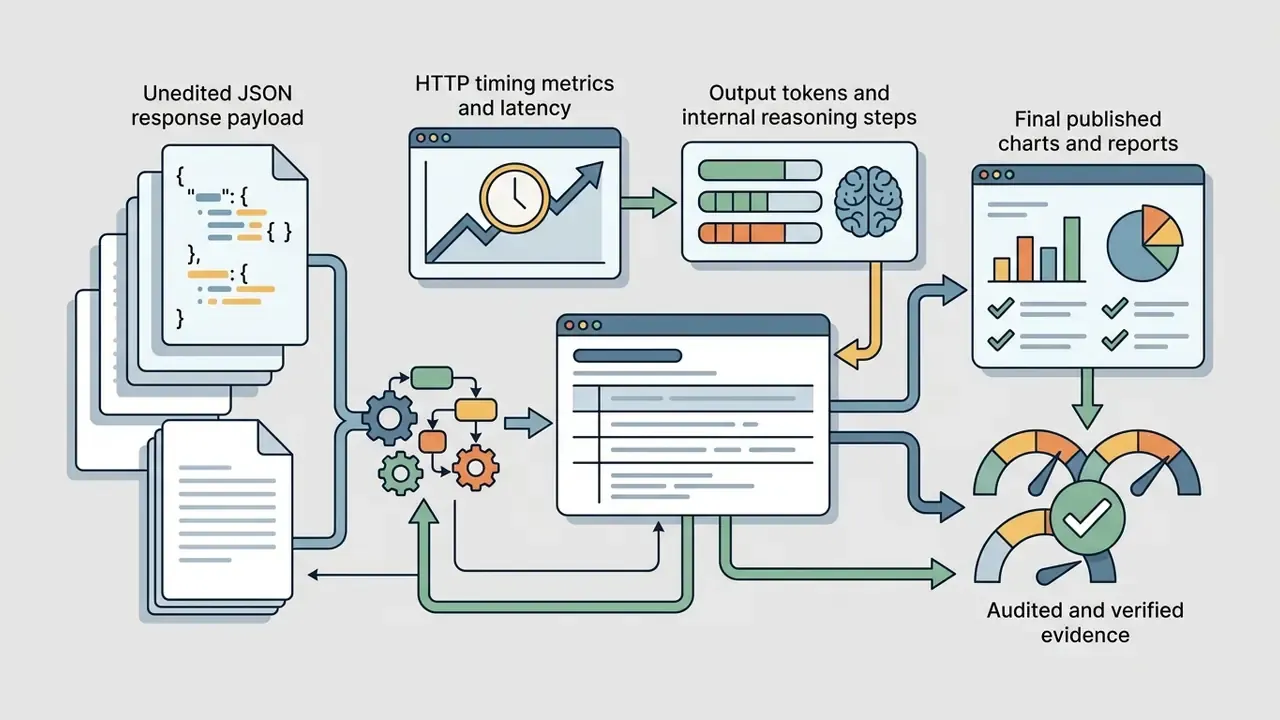
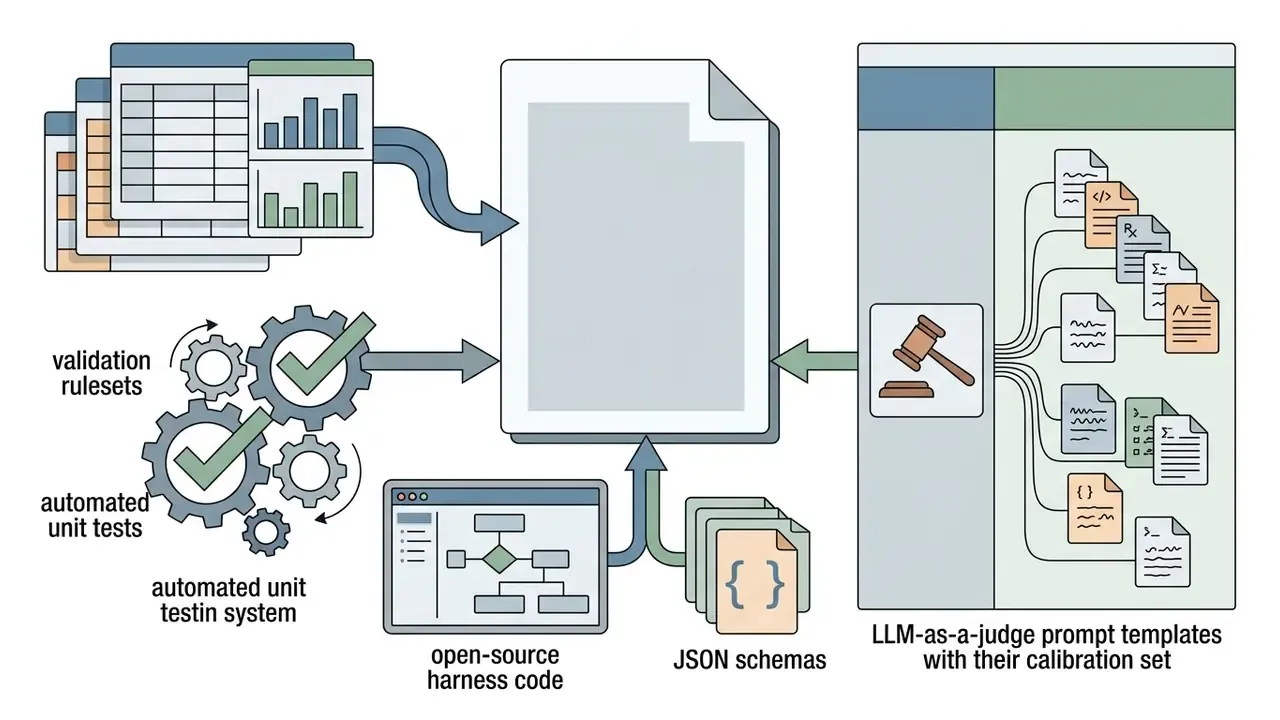
A cost per usable output benchmark report must contain comprehensive data tables, harness code, parameter logs, and dataset documentation to be considered trustworthy by internal auditors or supervisory reviewers.
Unverifiable marketing claims and undocumented internal tests introduce severe model risk. Enterprise teams should demand full transparency before accepting third-party performance benchmarks as decision-grade evidence.
Expected Net Cost Savings is the discipline that stops a benchmark from flattering itself. A response that is generated cheaply, delivered on time, and then ignored by the operator has negative economic value: it consumed compute and attention while contributing nothing. Model risk teams should require that any claimed saving be decomposed into the probability that a response is used, edited, or ignored, and that the ignored branch carry its full negative weight.
Required Components of Benchmark Reports and Data Tables
Complete evaluation reports must include four core operational artifacts:
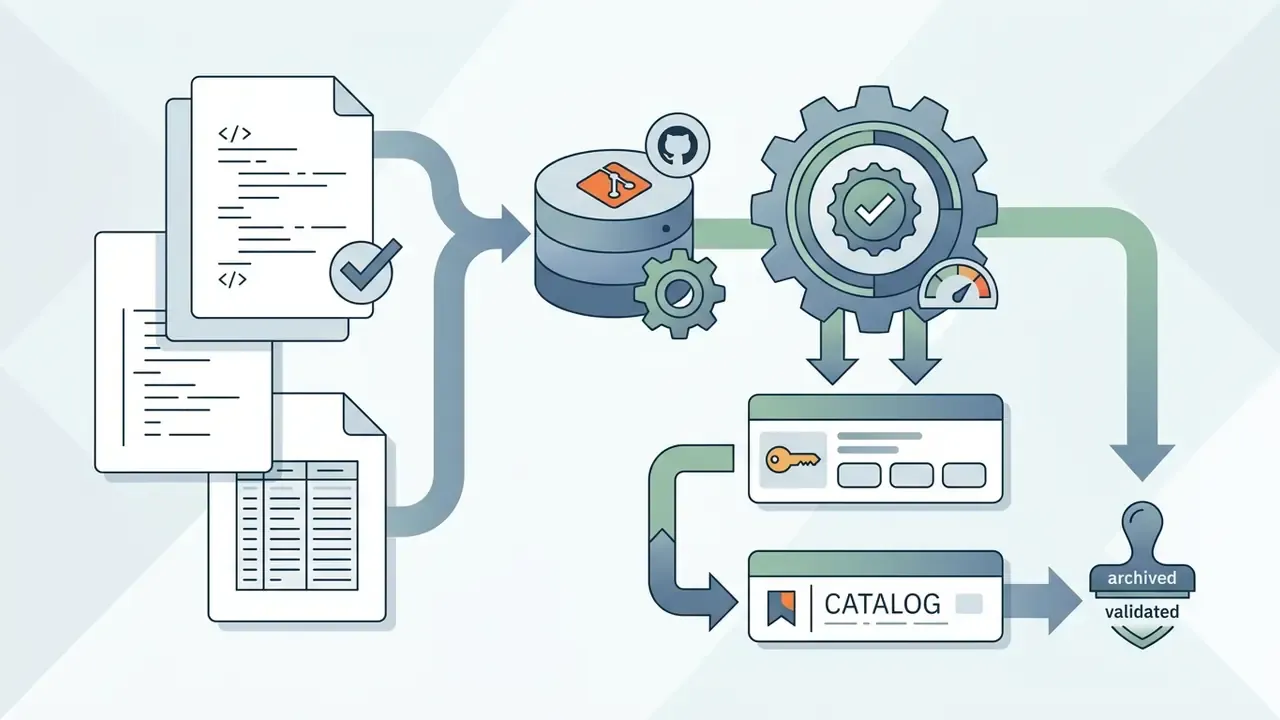
Data tables must be reconstructible from code and data alone. Preserve raw and processed layers, match the published row order, column order, and rounding, and ship a codebook plus README so a reviewer can regenerate every reported number without contacting the author.


Identifying Flawed and Incomparable Benchmarks
Model risk auditors should look first for the methodological flaws that invalidate benchmark comparisons outright:
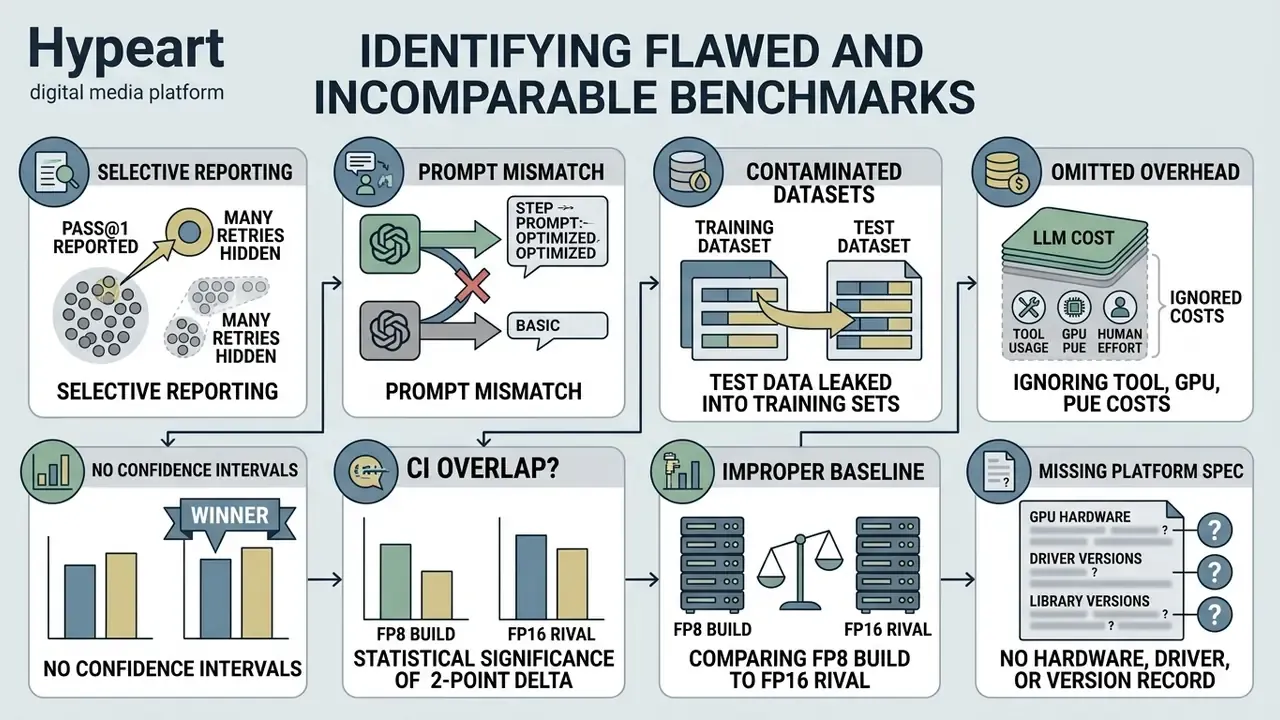
Incomparable benchmarks often evaluate one model with zero-shot prompts while granting a competing model multi-shot examples or external web search tools. Always verify that run conditions remain strictly identical across all tested candidates. The systems-performance literature names the recurring offences directly: selective benchmarking, improper baseline, misleading presentation, and missing platform specification. Public-sector benchmarking guidance adds that data should be validated and re-based to a common basis before any comparative figure is produced. Contamination control and construct validity are the two additional gates specific to LLM evaluation. A benchmark score is evidence only if the test data was not in training, and only if the task actually measures the capability you intend to deploy.
Regulatory Alignment: SR 11-7, OCC 2011-12, and NIST AI 800-2
For regulated financial institutions, a cost per usable output benchmark is not merely an engineering artefact. It is model validation evidence, and it should be structured to survive supervisory review.
- Conceptual soundness (SR 11-7 and OCC 2011-12, Section IV): document why the usable-output definition is the correct measurement of the model's intended business use, and why the acceptance thresholds correspond to the institution's stated risk appetite.
- Ongoing monitoring: the continuous benchmarking pipeline in §[21] is the monitoring control. Define thresholds at which a usable-rate decline triggers escalation, and specify who owns the decision to suspend automated routing.
- Outcomes analysis and benchmarking: cost per usable output, usable rate with confidence intervals, and pass@1 versus pass@k are outcomes-analysis artefacts. Retain them per model version in the model inventory.
- Effective challenge and independence: the second line must be able to re-run the harness independently from published code, seeds, and datasets. If it cannot, the benchmark is management assertion, not validation.
- Third-party and vendor models: where the model is a vendor API, the institution remains accountable for validation despite limited access to internals. The benchmark harness is often the only available conceptual-soundness evidence, which raises rather than lowers its documentation bar.
- Automated evaluation practice (NIST AI 800-2 draft, 2026): record benchmark size, model version, API and parameters, repeat count, and experiment date for every reported figure.
- Consumer-impact controls: where outputs influence credit, pricing, or account decisions, add adverse-action explainability and fair-lending testing to the usable-output definition. An output that is accurate but unexplainable is not usable in that context.
- Escalation: define, in advance, the residual-risk level at which a workload must revert from autonomous to human-in-the-loop, and register the trigger in the AI inventory or GRC platform alongside the model's owner and validation date.
E-E-A-T: primary sources and research repositories
- HELM (Holistic Evaluation of Language Models)
- Stanford CRFM benchmark repository providing standardized multi-metric model evaluations across core scenarios and prominent models (HELM framework).
- LMSYS Chatbot Arena
- crowdsourced human preference evaluation platform tracking real-world model utility, with a public leaderboard and published methodology.
- Artificial Analysis
- independent benchmark provider measuring LLM latency, throughput, token pricing, blended price, and cost-per-task metrics using fixed workloads, repeated tests, and P50 measurement windows (Artificial Analysis data).
- NIST AI 800-2 (draft, 2026)
- Practices for Automated Benchmark Evaluations of Language Models, documentation and reproducibility requirements.
- IETF draft (2026)
- Benchmarking Methodology for Large Language Model Serving, standardised serving and cost, latency, and throughput measurement.
- Federal Reserve SR 11-7 and OCC Bulletin 2011-12
- Supervisory Guidance on Model Risk Management, covering conceptual soundness, ongoing monitoring, outcomes analysis, and effective challenge.
FAQ for Auditors and Validators
How many prompts are enough for a decision-grade benchmark?
Derive it, do not guess. Detecting a 20-point usable-rate gap needs roughly 82 prompts per model at 95% confidence and 80% power. A 10-point gap needs roughly 199. A 4-point gap needs roughly 543. Multiply by your repeat count.
Is cost per usable output the same as cost-of-pass?
Structurally, yes: both divide per-attempt cost by success rate. Cost per usable output additionally loads human review, idle GPU capacity, and PUE overhead into the numerator, which matters in regulated workflows where a human always reviews the output.
Can we compare a vendor's published benchmark against our internal one?
Only if the run conditions match: same prompts, same decoding parameters, same precision build, same tool access, same shot count, same model revision. If any of those differ, the two numbers are not comparable and should not appear in the same table without a caveat.
Why report pass@k if production runs pass@1?
The gap between them measures brittleness. A workflow reported at 90% pass@3 but 60% pass@1 carries a hidden retry subsidy that will surface as latency and spend in production.
Should quantized builds be validated separately?
Yes. FP8 typically costs under 2% accuracy on standard suites, while INT4 costs 2 to 5% and is highly task-dependent. Precision is a model change for validation purposes, not an infrastructure detail.
What invalidates a benchmark fastest in review?
Missing platform specification, absent confidence intervals, undocumented prompt differences between candidates, and omitted human-review cost. In that order.
How often must the benchmark be re-run?
On a fixed cadence, weekly or monthly depending on workload materiality, plus on every trigger: model revision, price change, deprecation notice, or API contract change.
Appendix A: Glossary of Benchmark Metrics
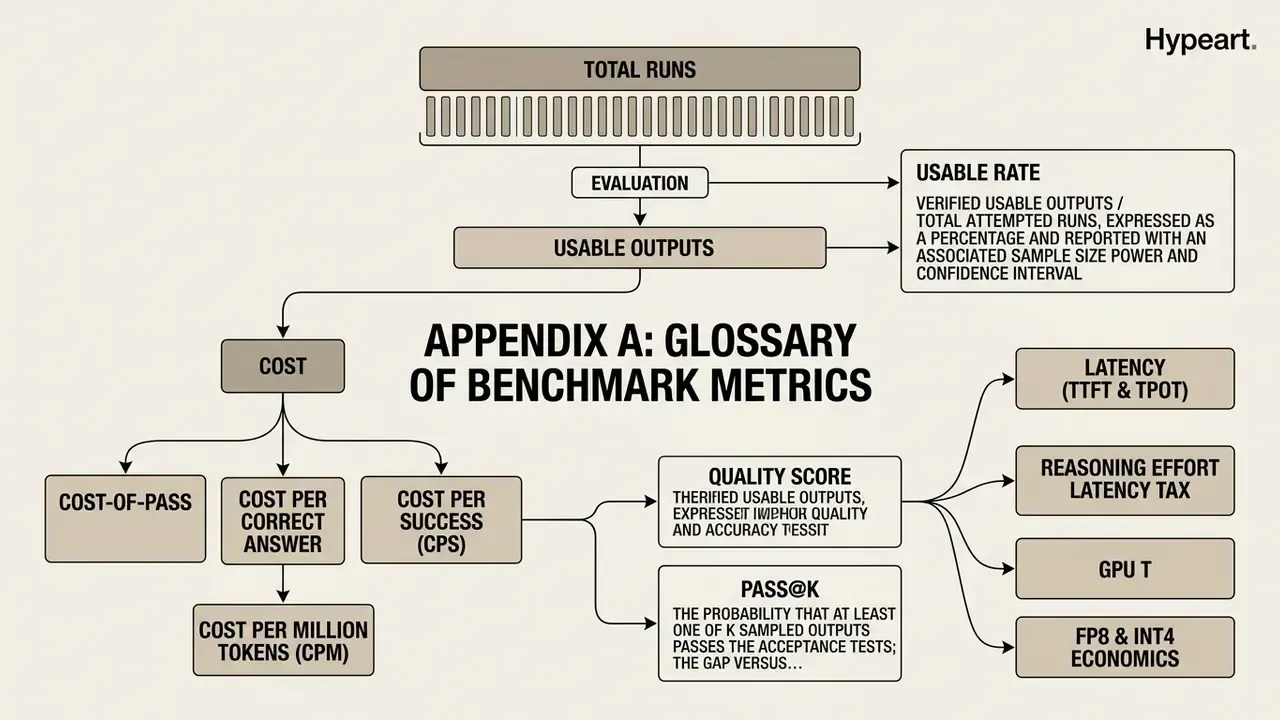
Cost per usable output. The total monetary cost, covering tokens, tools, infrastructure, idle capacity, and human review, required to generate one verified, compliant, and actionable result for a defined workload.
Cost-of-pass. An economic evaluation metric defined as per-attempt dollar cost divided by the task success rate (Erol et al., 2025).
Cost per correct answer. Total variable expenditure across all failed and successful attempts divided by the count of correct answers.
Cost per success (CPS). An enterprise agentic metric calculating total infrastructure, token, and tool expenditure divided by completed tasks (EfficientLLM, 2026).
Cost per million tokens (CPM). Cluster hourly cost divided by realised hourly token throughput, expressed per 1,000,000 tokens; the standard unit for self-hosted inference economics.
Quality score. A composite metric combining accuracy, schema validity, instruction adherence, and safety parameters. No canonical cross-vendor formula exists, so declare your components explicitly.
Usable rate. Verified usable outputs divided by total attempted runs, expressed as a percentage and reported with a confidence interval.
Pass@k. The probability that at least one of k sampled outputs passes the acceptance tests; the gap versus pass@1 measures brittleness.
Latency (TTFT and TPOT). Time-to-First-Token measures initial responsiveness. Time-per-Output-Token tracks generation speed, computed as (end-to-end latency minus TTFT) ÷ (total output tokens minus 1). Report p50, p90, and p99.
Latency tax. The multiplicative increase in TTFT incurred by raising reasoning effort, observed at 5 to 60 times between minimal and high tiers.
Over-engineering regression. A quality defect in which additional reasoning depth produces unrequested abstractions or cross-module edits that fail externally bounded tests.
Throughput. The volume of output tokens, requests, or completed tasks processed by a serving deployment per unit of time.
Token. The foundational unit of text or code processed by an LLM during prefill and generation, and the billing unit for most APIs.
Inference. The computational execution of a trained model to process prompts and generate predictions, measured by TTFT, TPOT, latency, and throughput.
Pareto frontier. The set of non-dominated configurations for which no alternative delivers higher quality at equal or lower cost on the declared cost axis.
PUE (Power Usage Effectiveness). A datacentre overhead multiplier, typically 1.1 to 1.5, applied to compute power draw when modelling self-hosted energy cost.
ENCS (Expected Net Cost Savings). The probability-weighted economic value of a model response, accounting for whether the operator uses, edits, or ignores it, minus generation cost.
Appendix B: Superseded Formulations and Baseline Versions
Retained for audit trail and version comparison.
Limitations and Open Questions
Honesty about the gaps is part of the evidence package, so here are ours.
The internal reconciliation and refactoring cases in this article are illustrative and hypothetical. They have not been externally reproduced, and their sample sizes, intervals, and savings figures should be read as directional only. Treat every audience assumption about buying criteria the same way: hypothesis until analytics, interviews, CRM data, or verified customer research support it.
Three methodological questions remain genuinely unsettled. How should be attributed when one reviewer handles a queue of mixed-model outputs? What is the right decay function for benchmark validity after a silent vendor weight update, given that revision hashes are not always exposed? And how should a fair-lending review treat an accurate output whose reasoning trace is unavailable by design?
Cost figures in this article carry a shelf life measured in weeks. Prices move, hardware tiers rotate, and frontier variants are renamed. Recompute before you commit capital.
Cost Optimization Planning and Next Steps
Evaluating model efficiency requires ongoing monitoring, budget modeling, and rigorous governance testing. Build the projection bottom-up from the components in §[6] and §[11]: token classes at current published rates, tool and sandbox runtimes, instance-hours at your realised utilisation and precision, PUE-adjusted energy, reserved idle capacity, and fully loaded reviewer minutes. Then divide by the measured usable rate for each routed tier. Re-run the model whenever a provider price, model revision, or precision build changes.
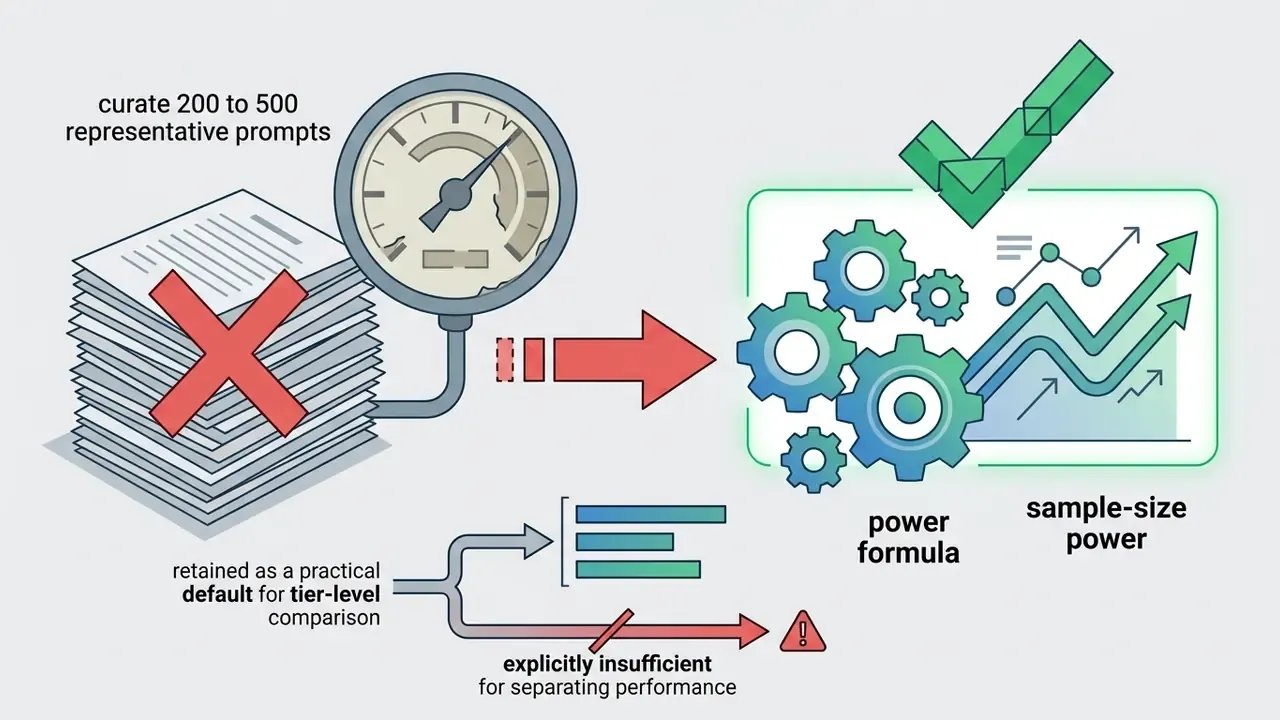
A safe first step, before any procurement decision: pick one production workload, define its usable-output rubric, and run a 200-prompt harness against your current model and one open-weight alternative. Two weeks of work, and it usually resets the conversation.
For a hands-on way to model metered consumption against a budget ceiling, the AI Video Credit Calculator shows how quota tiers, per-request pricing, and rate limits compound into a monthly figure. It is an adjacent-modality worked example of the same principle argued throughout this article: when the metered unit is not the unit of business value, the workload will be mispriced.
To review additional evaluation frameworks, model risk research, and comparative AI performance studies, explore the hub for detailed documentation.