"When evaluating generative models for enterprise deployment, the primary operational risk is unmonitored variable expenditure. Establishing strict token accounting before deployment is essential for maintaining control over operational budgets."
Executive Summary
Three sentences for decision-makers. LLM API spend is a variable, consumption-based line item calculated as (input tokens × input rate) + (output tokens × output rate), multiplied by request volume, with output tokens priced 4× to 6× higher than input tokens across every major provider. Uncontrolled context growth, hidden reasoning tokens, multimodal image tiles, and autonomous agent loops are the four factors that most frequently push actual invoices 30% to 50% above initial estimates. Structural controls (prompt caching, model routing, hard output ceilings, automated circuit breakers) reduce total API expenditure by 40% to 90% without measurable quality degradation.
- Unit economics first. Model the cost of a single request before modeling the monthly budget. A 10k-input / 2k-output call ranges from $0.0027 (Mistral Small 4) to $0.1100 (GPT-5.6 Sol). That is a 40× spread on identical workloads.
- Budget variance is engineered, not discovered. Output caps, cache-hit ratios, routing thresholds, and per-tenant quotas are the levers that convert a volatile invoice into a predictable one.
- Governance is mandatory at scale. Token accounting, chargeback attribution, and spend circuit breakers belong in model risk management (MRM) validation evidence, not in a corner of an engineering wiki.
Who This Guide Is For and What It Assumes
In short: this is a working reference for the people who sign off on AI spend, not a vendor comparison sheet.
If you own a model risk function, a finance transformation programme, or a control framework at a US bank or a mature fintech, the practical question is rarely "which model is best?" It is narrower: what will this feature cost per request, per day, and per quarter, and who is accountable when the number moves?
Three assumptions run through everything below.
One more framing note before the mechanics. A calculator is a forecasting instrument, not a decision. The decision is whether the forecast, with its uncertainty stated honestly, fits your institution's risk appetite.
Deploying generative models into production requires shifting from fixed infrastructure estimates to variable, consumption-based financial models. Managing token expenditure is a core requirement for technology and risk executives overseeing enterprise software integration. Without clear token accounting, unexpected billing variances disrupt project continuity and obscure true operational returns.
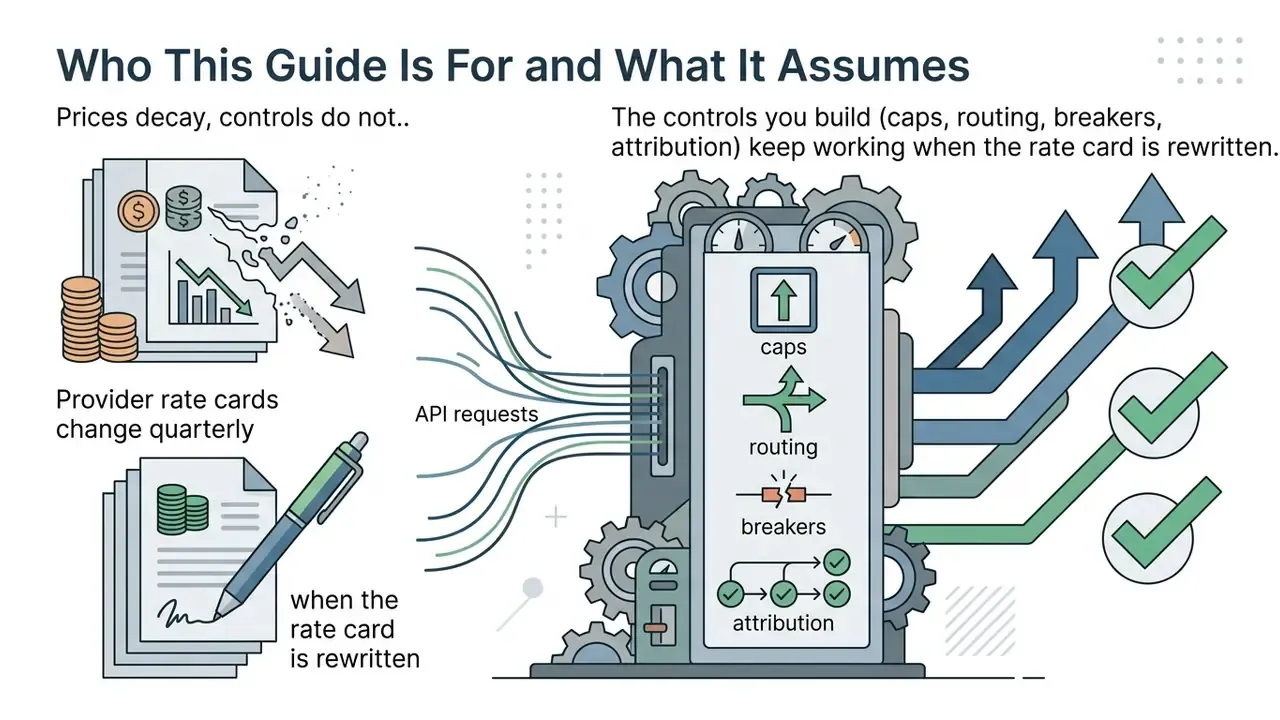
"The price of access to a fixed level of performance falls roughly 5× to 10× per year, while the cost of the absolute frontier models rises 3× to 18× annually."
That asymmetry is precisely why static budgeting fails. The cheapest path to a given capability keeps getting cheaper, while the temptation to run every workload on the newest flagship keeps getting more expensive.
How an AI API Cost Calculator Works
Expenses Included in API Cost Calculation
In short: three cost buckets matter, namely input tokens, output tokens, and non-token overhead such as per-call search fees or reserved throughput.
A comprehensive financial forecast accounts for every component of the API transaction lifecycle. The baseline equation combines the input cost associated with ingested context and the specific rate charged per output token. High-volume production deployments must also factor in overall request volume (api calls), the average density of tokens per transaction, and fixed platform overheads where applicable.
- Input Token Expenses: billed for processing prompt instructions, system guardrails, tool and function schemas, retrieved RAG context, and conversational history.
- Output Token Expenses: billed for the text or reasoning sequences generated by the model, including internal "thinking" tokens on reasoning-tier architectures.
- Fixed and Endpoint Overhead: specific platform features, such as external web search integration, grounding, or dedicated throughput reservations, which add per-call or hourly charges independent of token volume.
- Adjacent Pipeline Costs: vector embedding generation for RAG ingestion, fine-tuning training runs, and image or audio tokenization, each billed under separate rate cards.
The final cost total reflects the sum of these directional charges multiplied by total transaction volume over the evaluation window.
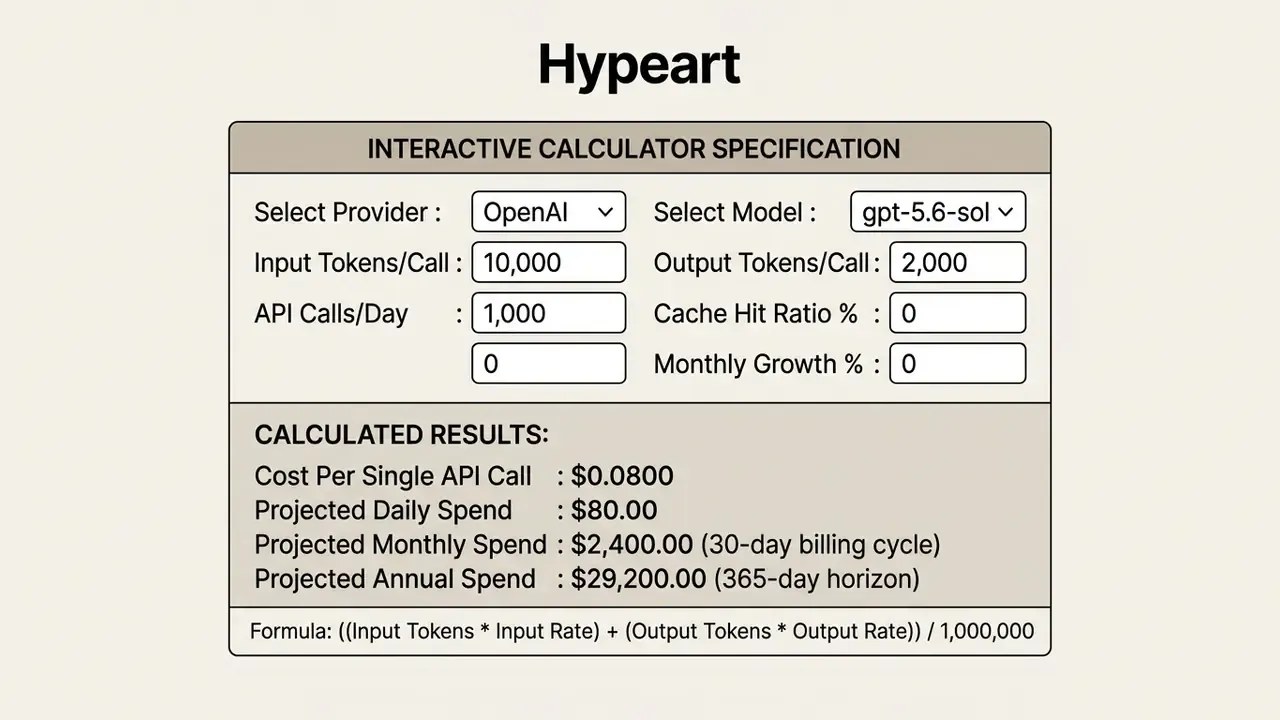
A production-grade calculator should also expose a monthly growth factor. Modeling a 15% month-over-month traffic increase turns a $2,400 baseline into roughly $4,830 by month six. That variance matters far more to a quarterly budget than a rounding difference in the token rate.
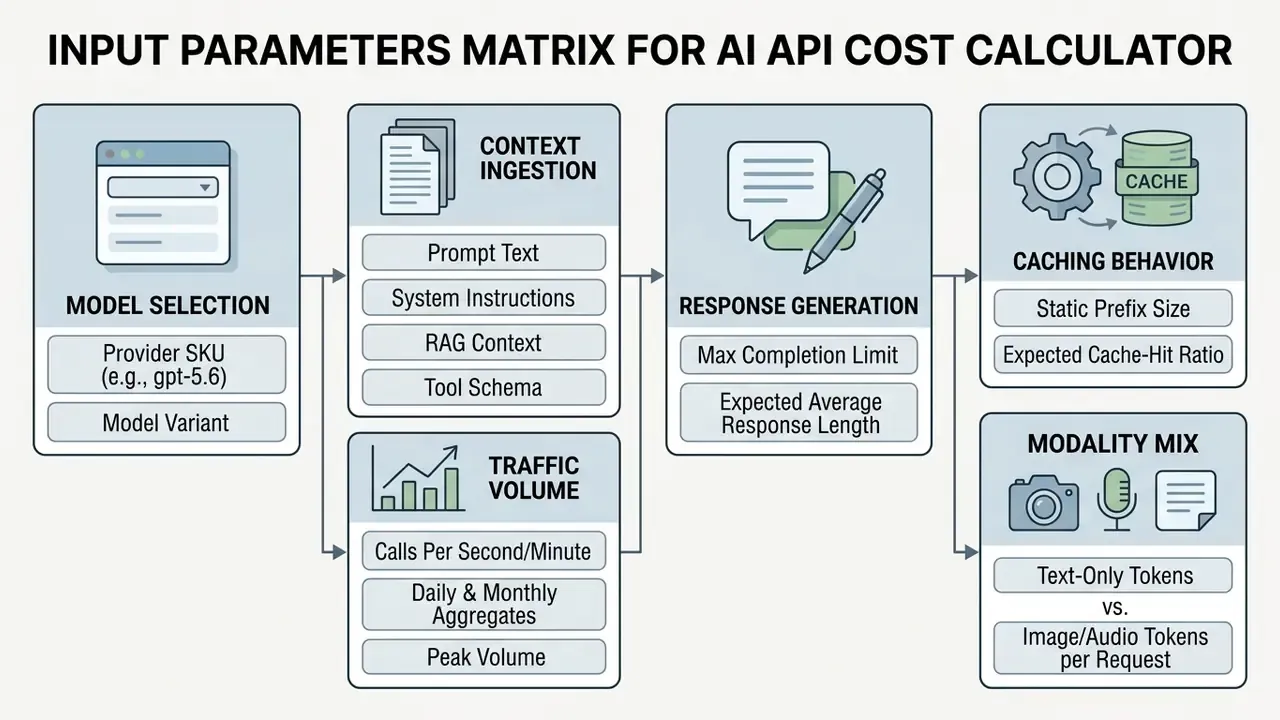
Inputs Required for an AI API Cost Calculator
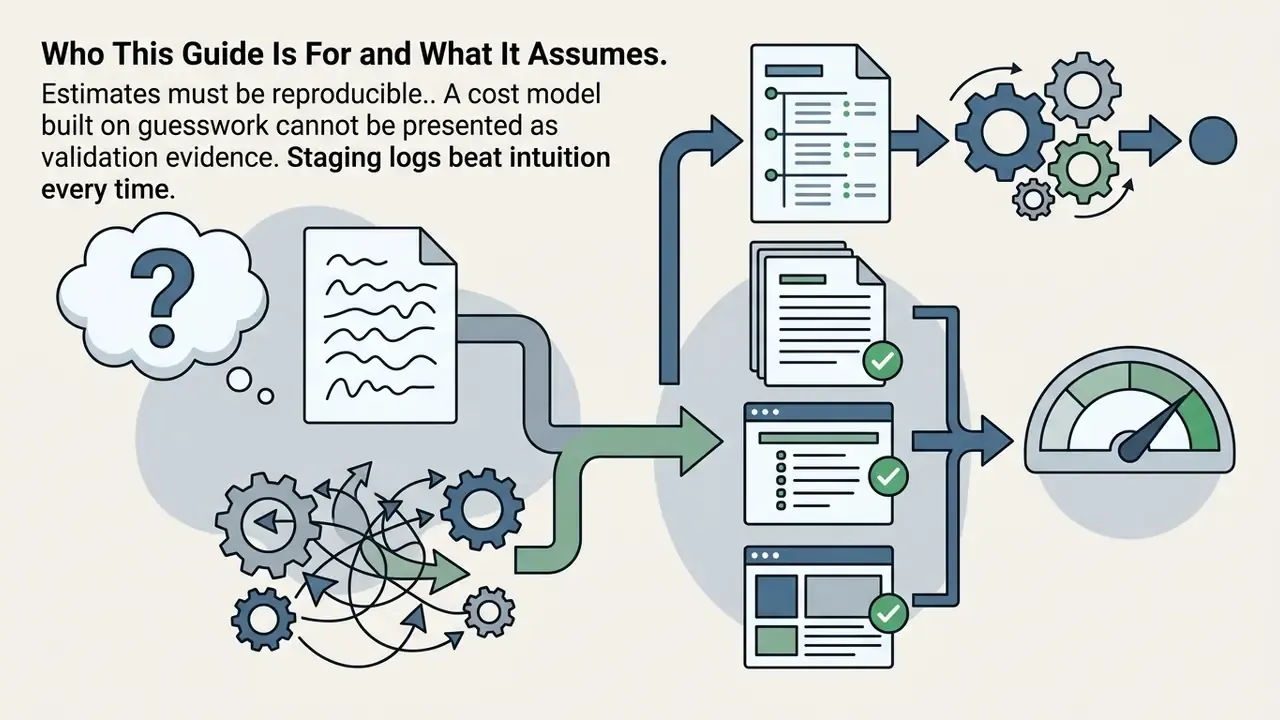
In short: accurate forecasts require four parameter families, namely model SKU, ingested context volume, expected response length, and traffic distribution. Estimates built on hypothetical averages instead of staging-environment logs are the single largest source of budget error.
To generate an accurate forecast using an ai api cost calculator usage guide, developers and finance teams must supply precise operational metrics. Providing standardized ai api cost calculator inputs keeps projected expenditures anchored in realistic operating conditions rather than best-case assumptions.
Input Tokens: Prompts, System Instructions, and Context
In short: every character sent to the model is billed as input, including the system prompt, tool definitions, retrieved documents, and the full conversation history replayed on each turn.
Understanding that a token is the fundamental unit of compute accounting is essential for prompt architecture design. In English text, one token typically equates to roughly four characters or 0.75 words. In non-English languages such as Russian, tokenization is denser, often requiring 2 to 3.3 tokens per word because of subword splitting (OpenAI Tokenizer Documentation, 2026). Teams working across modalities should apply the same density logic to non-text pipelines; the same accounting principle governs text-to-video AI tools, where frames and audio segments are converted into billable units before inference begins.
When calculating input tokens, aggregate every character string passed into the prompt array:
- Core system guidelines and safety policies.
- Tool, function, and JSON schema definitions.
- Dynamic user queries.
- Retrieved background documents (RAG context).
- Retained dialogue history in multi-turn interactions.
As context accumulates, the volume of input text grows, directly elevating the baseline input cost for every subsequent call in a session. In an unpruned 20-turn conversation, the final request can carry 15× the token load of the first. Nobody plans for that. It simply happens, one polite follow-up question at a time.
Output Tokens: Response Length and Model Boundaries
In short: output volume is capped by max_output_tokens but driven by median generated length, and reasoning models bill invisible internal thinking tokens at the full output rate.
The generated response is measured in output token units. Because models generate text iteratively, calculating tokens output requires tracking average completion lengths rather than relying solely on hard ceiling parameters such as max_completion_tokens.
Output caps prevent runaway billing caused by infinite generation loops, yet financial models still need realistic median outputs. Because providers price response generation significantly higher than context ingestion, minor increases in completion length exert a disproportionate impact on tokens cost and on the resulting aggregate cost total. Note also that some hosted platforms apply quota burndown multipliers: a single output token can consume 5×, 10×, or 15× of a model's throughput allocation, which constrains concurrency even when the dollar cost looks acceptable.
API Calls, Request Frequency, and Budgeting Period
In short: convert daily request volume into a requests-per-second figure to size rate limits, then multiply per-call cost by volume to produce the daily, monthly, and annual budget lines.
To scale a single-call estimate into an enterprise budget projection, financial models must incorporate total request volume over defined timeframes. Estimating api calls requires analyzing peak and baseline transaction rates, not just a comfortable average.
A standard method for determining request frequency incorporates transaction distribution:
This figure connects to the financial model in two ways. First, it validates feasibility against provider rate limits: an RPS value that exceeds the vendor's Requests-Per-Minute (RPM) or Tokens-Per-Minute (TPM) ceiling means the projected budget is unachievable without a capacity uplift or a multi-key architecture. Second, it anchors the budget chain:
Projecting tokens per transaction across daily, monthly, or annual windows lets organizations establish spending thresholds, configure automated alerting, and align usage limits with organizational risk tolerance. Where peak-hour traffic exceeds baseline by a factor of three or more, model the peak RPS separately. Burst capacity, not average load, determines both rate-limit sizing and worst-case daily spend.
In a recent financial technology deployment, an organization evaluated automated document reconciliation pipelines using our AI Media API guidelines. The engineering team audited prompt context sizes and imposed strict output token ceilings before production rollout; internal post-implementation reporting indicated that this removed a substantial share of the projected month-over-month billing variance. The figure comes from a single internal deployment review rather than an externally audited benchmark, so treat it as directional evidence for the practice, which is context auditing plus output caps, rather than as a transferable percentage.
Baseline Usage Presets by Enterprise Application Type
In short: if your team has not yet collected production telemetry, initialize the cost model with industry-standard token ratios by workload type, then replace them with staging logs before final budget approval.
Most cost-estimation failures start with a blank field. Nobody knows how many tokens a "typical" request will actually consume. The presets below provide defensible starting values for the five most common enterprise workloads, plus two that people forget until the invoice arrives.
| Application Workload | Avg Input Tokens / Request | Avg Output Tokens / Request | Standard Input/Output Ratio | Cost Sensitivity Driver |
|---|---|---|---|---|
| Customer Support Chatbot | 1,500 (incl. system instructions & history) | 250 | 6 : 1 | Conversation history growth |
| Code Generation Agent | 4,000 (incl. codebase context & files) | 800 | 5 : 1 | Repository context size |
| Document Summarization (RAG) | 12,000 (retrieved chunks + document) | 500 | 24 : 1 | Retrieval chunk count |
| Data Extraction / Classification | 800 | 50 | 16 : 1 | Request volume, not length |
| Multi-Turn Autonomous Agent | 25,000 (accumulated session state) | 1,200 | 21 : 1 | Loop depth and tool calls |
| Translation Service | 1,000 | 1,100 | 1 : 1.1 | Output-dominant, high unit cost |
| Q&A / Search Assistant | 2,500 (query + grounding results) | 350 | 7 : 1 | Search surcharges per call |
Two structural observations follow from this table. Input-heavy workloads such as RAG summarization benefit disproportionately from prompt caching and retrieval pruning, because roughly 96% of their token volume sits on the cheaper side of the rate card. Output-heavy workloads such as translation and long-form content generation benefit instead from model downgrading and hard output ceilings, because the expensive direction dominates the bill.
The AI API Cost Calculator Formula
In short: total request cost is the sum of two independent products, namely input tokens times the input rate, and output tokens times the output rate, each divided by one million.
Validating automated estimation tools requires understanding the underlying mathematical logic. Applying an ai api cost calculator formula manually lets architecture teams verify software estimates against raw provider rate sheets.
Calculating Input and Output Token Costs Separately
Because vendors establish distinct price tiers for context ingestion versus response generation, calculating API expenditure requires a two-part equation. The fundamental formula separates context costs from generation costs before combining them into a single transaction value:
Where:
- = total cost for a single API call
- = number of input tokens
- = price per 1,000,000 input tokens
- = number of output tokens
- = price per 1,000,000 output tokens
Where prompt caching is active, the input term splits into three components: uncached input at full rate, cached reads at a discounted rate (commonly 10% of base input), and cache writes at a premium (commonly 1.25× base input):
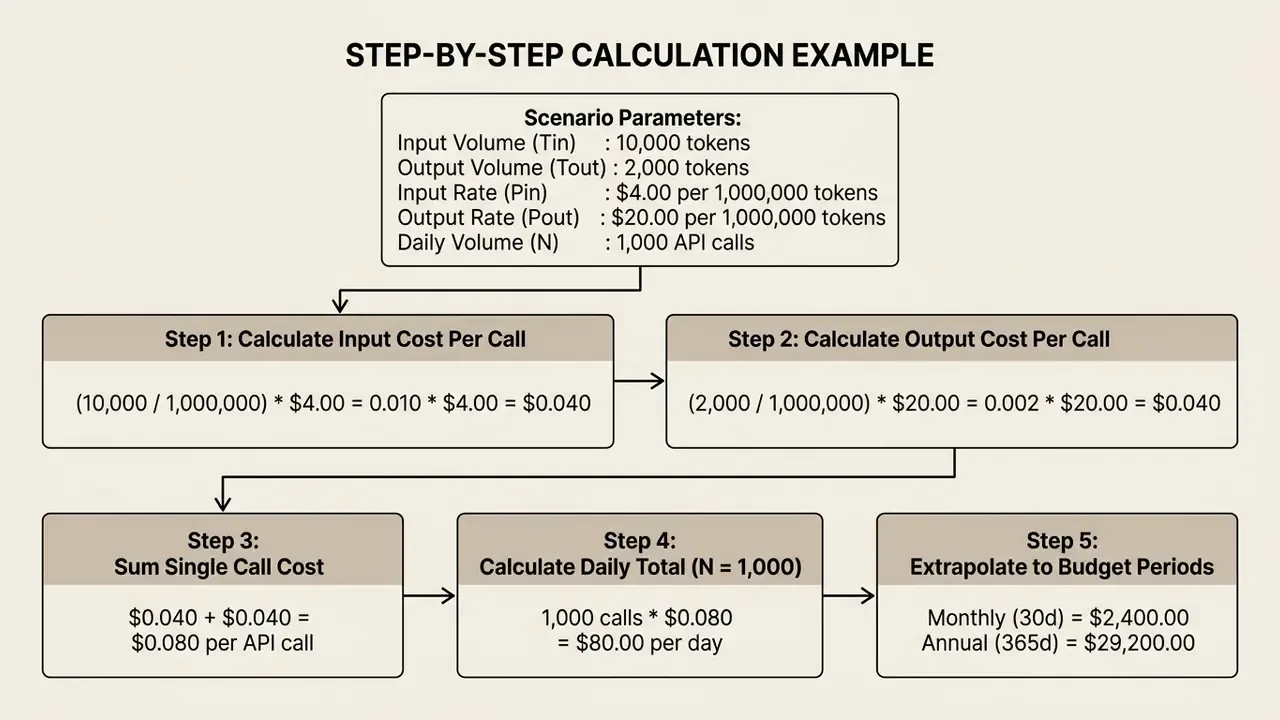
Note the structural insight buried in this example. Input volume is five times larger than output volume, yet each side contributes exactly $0.040. Token count and token cost are not the same quantity, and optimization effort should follow dollars rather than tokens.
Converting Price per Million Tokens into Cost per Request
In short: divide the token count by 1,000,000, multiply by the published rate, and repeat for each billing category before summing.
Enterprise pricing schedules quote rates per one million tokens. To translate these large-scale rates into per-request values, divide the token count by before applying the unit rate. The four-step algorithm:
- Retrieve the provider's published per-1M rates for every billing category (input, cached input, cache write, output).
- Estimate the token count in one request separately for each category.
- Convert each count to dollars: .
- Add any non-token per-call fees (web search, grounding, reserved throughput).
Evaluating the structural ratio between input and output rates reveals significant pricing asymmetry. Across leading providers, output token rates run typically to higher than input rates for identical model tiers, a ratio verified directly against vendor rate cards rather than inferred from academic modeling. For instance, OpenAI's gpt-5.6-sol tier is listed at $5.00 per 1M input tokens versus $30.00 per 1M output tokens, a premium on generated output (OpenAI API Pricing Documentation, 2026). Anthropic's Claude Opus 5 shows a ratio ($5.00 input / $25.00 output), and Amazon Bedrock's Claude listings follow the same structure.
When assessing multimodal workflows or specialized video processing pipelines, dedicated technical references such as our AI Video API Pricing Guide and the AI video API pricing implementation notes add clarity on non-text unit conversions, where billing is often per-second or per-frame rather than per-token.
Calculating Multimodal and Vision API Token Costs
In short: image inputs are converted to tokens through a deterministic tiling algorithm. Count the 512×512px tiles, multiply by 170 tokens, and add an 85-token base overhead per request.
Unlike text inputs, image inputs are converted into tokens based on image dimensions and detail settings. For OpenAI GPT-4.1, GPT-5, and successor vision requests, processing follows a deterministic tiling algorithm:
- Resolution Scale-Downif any dimension exceeds 2048px, the image is scaled down to fit within a 2048×2048px bounding box.
- Shortest Side Rescalingif the shortest side still exceeds 768px, it is scaled to 768px.
- Tile Calculationthe scaled image is divided into tiles.
- Token Assemblyeach tile consumes 170 input tokens, plus a static base overhead of 85 tokens per request.
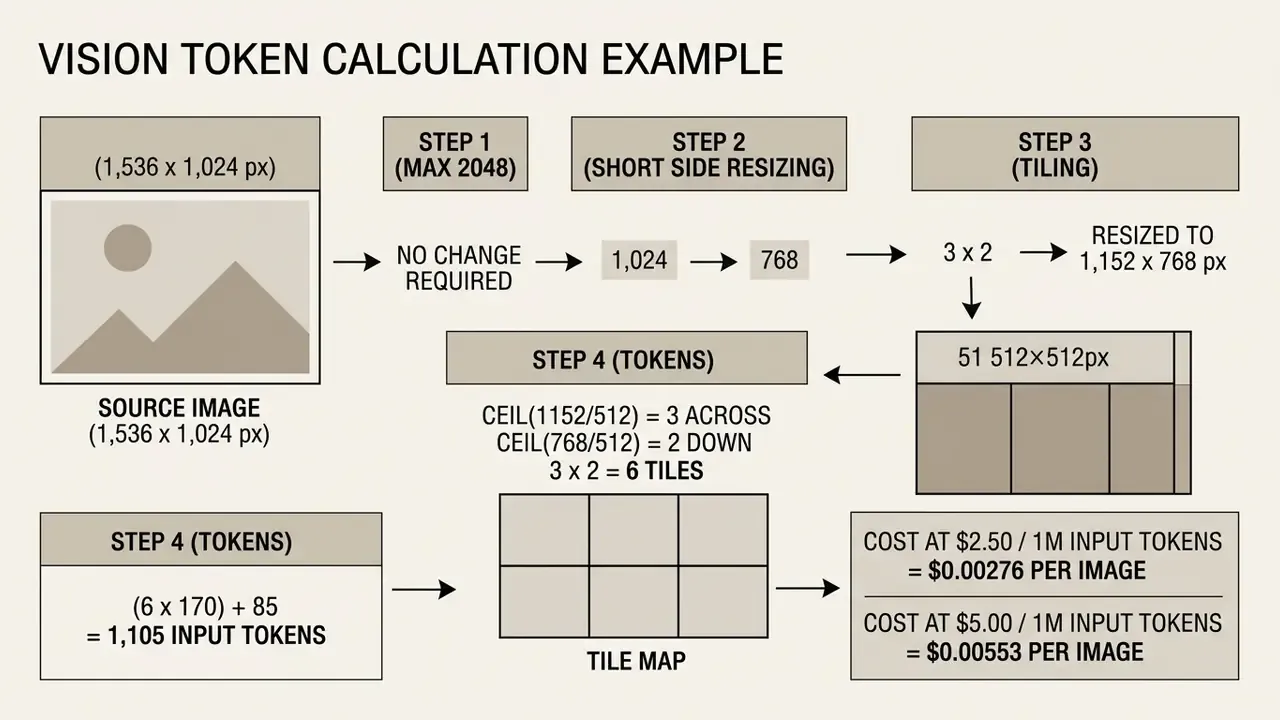
Three practical consequences follow. First, a low-detail flag typically bills a flat base cost with no tiling, which makes it the correct default for thumbnail classification. Second, batching multiple images into one request does not eliminate the 85-token base charge per image, so document-page pipelines should be modeled per page, not per document. That distinction alone can move a KYC document review budget by a factor of ten. Third, image generation endpoints invert the model: output tokens are fixed by resolution and quality tier (a high-quality 1024×1536 render bills roughly 6,240 output tokens), so generation cost is predictable to the cent once the render preset is chosen. For teams comparing generation quality against per-image cost, our review of AI art generators by quality, control, and pricing applies the same unit-economics logic to visual workloads.
Calculating Embedding and Fine-Tuning Operational Costs
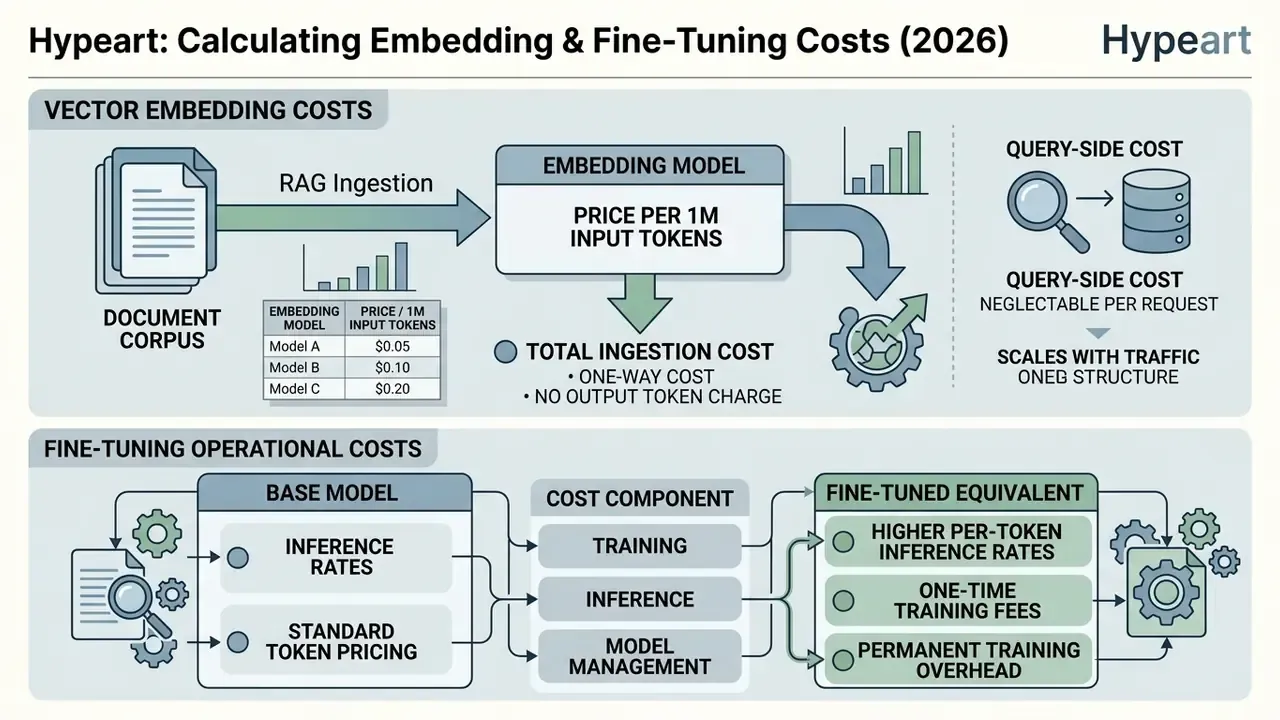
In short: RAG ingestion and custom model specialization are billed on separate rate cards, embeddings as one-way input tokens, fine-tuning as a training fee plus a permanently elevated inference rate.
Enterprise RAG (Retrieval-Augmented Generation) and custom model specialization introduce operational expenses that sit entirely outside standard chat inference. They are routinely omitted from first-pass budgets.
Vector Embedding Pricing (per 1M Input Tokens)
Vectorizing a document corpus is a one-way ingestion cost, since there is no output token charge, but it recurs every time the corpus is re-indexed or the embedding model is upgraded.
| Embedding Model | Price / 1M Input Tokens | Cost to Embed 100M-Token Corpus |
|---|---|---|
| OpenAI text-embedding-3-small | $0.02 | $2.00 |
| OpenAI text-embedding-3-large | $0.13 | $13.00 |
| OpenAI text-embedding-ada-002 | $0.10 | $10.00 |
| Cohere Embed v3 | $0.10 | $10.00 |
| Mistral Embed | $0.10 | $10.00 |
| Amazon Titan Embeddings | $0.10 | $10.00 |
Query-side embedding costs are usually negligible per request but scale with traffic: 1 million user queries at 40 tokens each consume 40M tokens, or $0.80 on text-embedding-3-small. The dominant embedding risk is re-indexing. A full corpus rebuild triggered by a chunking-strategy change repeats the ingestion cost in a single day, often without a change ticket attached to it.
Fine-Tuned Model Overhead
Custom fine-tuned models carry higher per-token inference rates alongside one-time training fees, and that inference premium persists for the life of the deployment.
| Cost Component | Base Model | Fine-Tuned Equivalent |
|---|---|---|
| Training (per 1M training tokens) | n/a | $25.00 |
| Inference input / 1M tokens | $2.50 | $3.75 (+50%) |
| Inference output / 1M tokens | $10.00 | $15.00 (+50%) |
| Cost per 10k-in / 2k-out call | $0.0450 | $0.0675 |
The break-even calculation matters more than the training fee. If fine-tuning removes 3,000 tokens of few-shot examples from every prompt, the input saving ($0.0075 per call at base rates) can outweigh the 50% inference premium at sufficient volume, but only if request volume is high and prompt compression is genuine. Below roughly 100,000 monthly calls, prompt optimization plus caching usually delivers better economics than a fine-tuned SKU. There is also a governance cost that rarely appears in the spreadsheet: a fine-tuned model is a new model, with its own validation and documentation obligations.
Why Estimated Costs Differ From the Final Invoice
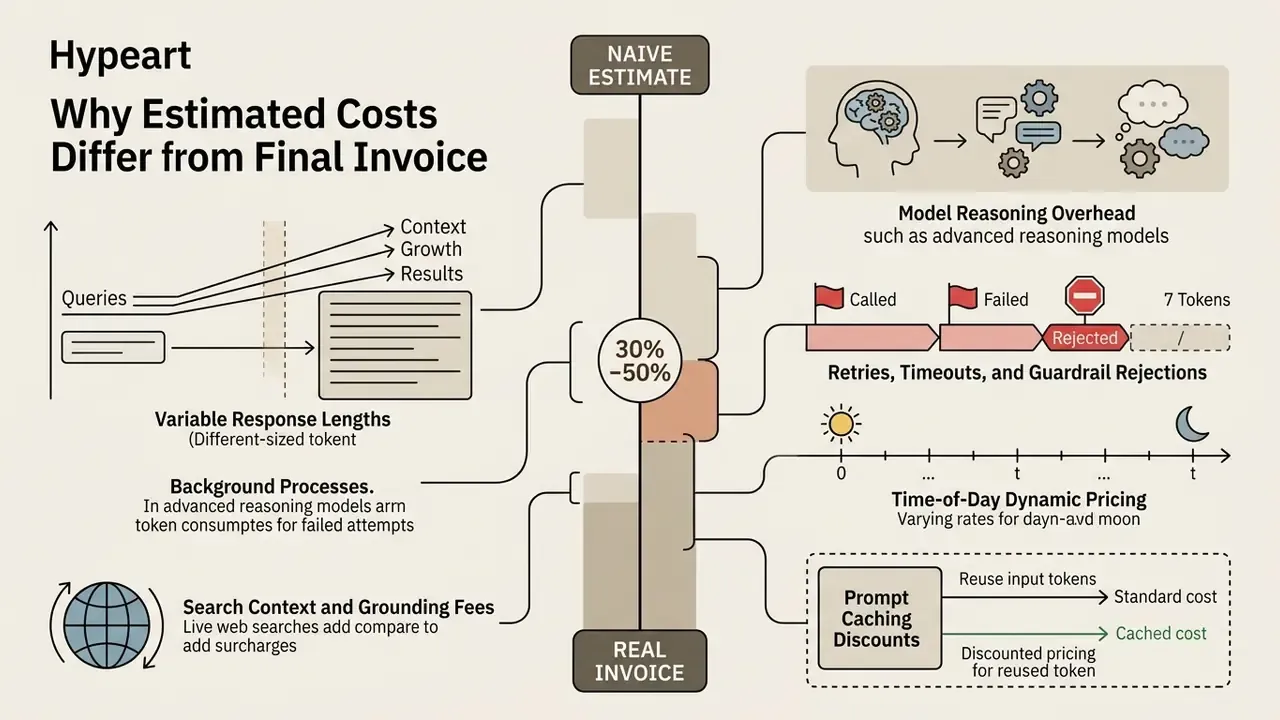
In short: expect a 30% to 50% gap between a naive estimate and the first real invoice, driven by context growth, hidden reasoning tokens, retries, time-of-day tariffs, search surcharges, and, most dangerously, autonomous agent loops.
Preliminary cost estimates frequently diverge from actual monthly invoices. A primary driver of this variance is fluctuation in the actual tokens number transmitted per call during live operations. Static calculations often assume fixed prompt lengths, whereas real-world user queries and multi-turn conversations expand context non-linearly.
Dynamic system features add further billing complexity:
Comparing API Pricing Models and Providers
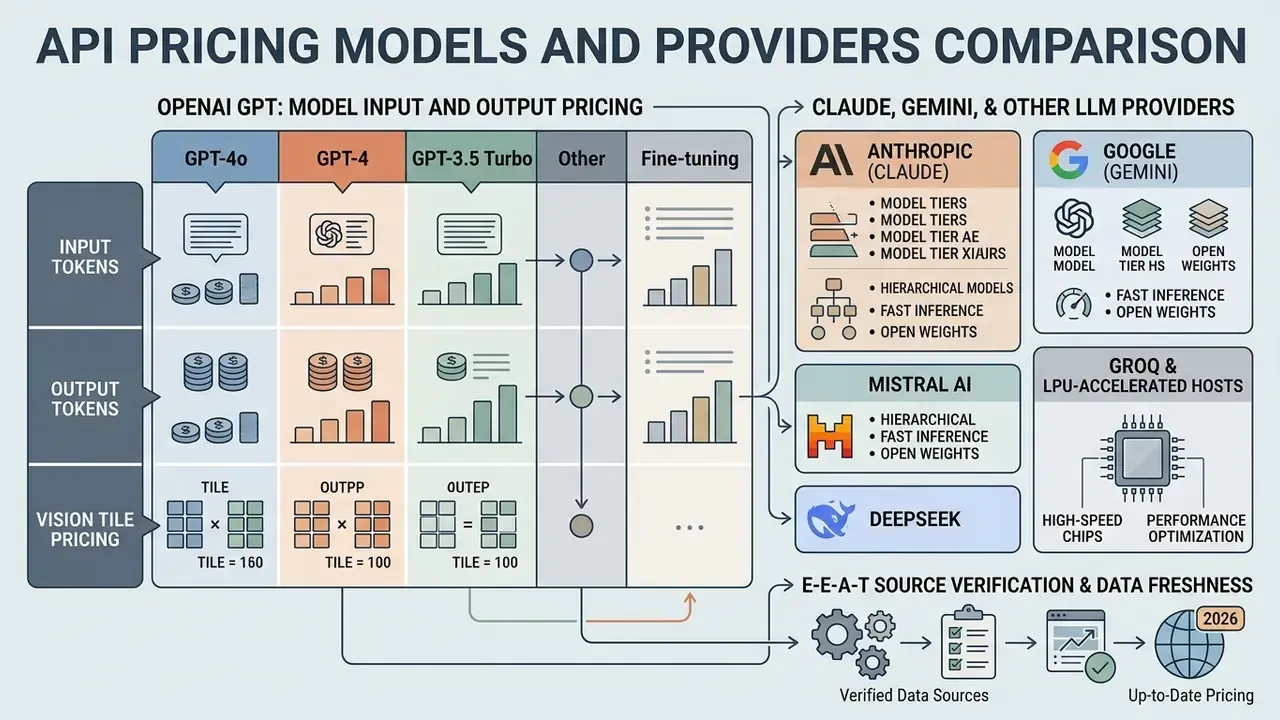
In short: the 2026 market splits into proprietary per-token APIs, specialized hosted inference for open-weight models, and partner infrastructure hosting, with a 40× cost spread across tiers that deliver comparable results on routine tasks.
Selecting an enterprise provider requires evaluating cost structures across different model families. The LLM market in 2026 comprises three primary delivery models:
- Per-Token Proprietary APIs direct consumption billing managed by primary developers (OpenAI, Anthropic, Google).
- Specialized Hosted Inference platforms hosting open-weight or regional models with competitive per-token rates (Mistral, DeepSeek, xAI, Groq, Qwen, Zhipu, MiniMax).
- Open-Weight Partner Infrastructure infrastructure-as-a-service hosting (AWS Bedrock, Azure) serving models such as Meta's Llama line, where costs depend on hardware utilization or managed token rates.
"The cost of processing one million tokens fell from $60 for GPT-3 in early 2022 to $0.06 for LLaMA 3.2 3B by mid-2024, a thousandfold reduction."
That trajectory is the strongest argument for re-running your cost model quarterly rather than annually. A workload that was economically impossible last year may be trivially affordable now on a lower tier.
| Provider | Model Tier | Input Price / 1M Tokens | Output Price / 1M Tokens | Cost per 10k-In / 2k-Out Call |
|---|---|---|---|---|
| OpenAI | gpt-5.6-sol | $5.00 | $30.00 | $0.1100 |
| OpenAI | gpt-5.6-terra | $2.00 | $12.00 | $0.0440 |
| OpenAI | gpt-5.6-luna | $0.20 | $1.20 | $0.0044 |
| OpenAI | gpt-5.4-mini | $0.75 | $4.50 | $0.0165 |
| OpenAI | gpt-5.4-nano | $0.20 | $1.25 | $0.0045 |
| Anthropic | Claude Opus 5 | $5.00 | $25.00 | $0.1000 |
| Anthropic | Claude Sonnet 5 | $2.00 | $10.00 | $0.0400 |
| Anthropic | Claude Haiku 4.5 | $1.00 | $5.00 | $0.0200 |
| Gemini 2.5 Pro (200k context) | $1.25 | $10.00 | $0.0325 | |
| Gemini 2.5 Flash | $0.30 | $2.50 | $0.0080 | |
| Gemini 2.5 Flash-Lite | $0.10 | $0.40 | $0.0018 | |
| Mistral AI | Mistral Large 3 | $0.50 | $1.50 | $0.0080 |
| Mistral AI | Mistral Small 4 | $0.15 | $0.60 | $0.0027 |
| DeepSeek | DeepSeek V4 Flash (off-peak) | $0.22 | $0.66 | $0.0035 |
| DeepSeek | DeepSeek V4 Flash (peak) | $0.44 | $1.32 | $0.0070 |
| xAI | Grok 4.3 | $1.25 | $2.50 | $0.0175 |
| Meta (hosted) | Llama 4 Maverick | $0.22 | $0.85 | $0.0039 |
| Groq | Llama 3.1 70B (LPU accelerated) | $0.59 | $0.79 | $0.0075 |
| Qwen | Qwen 3.7 Max | $2.50 | $7.50 | $0.0400 |
| Zhipu AI | GLM-5.1 | $1.40 | $4.40 | $0.0228 |
| Moonshot | Kimi K2.6 | $0.95 | $4.00 | $0.0175 |
| Cohere | Command-a | $2.50 | $10.00 | $0.0450 |
| Perplexity | Sonar Pro (+ search fee) | $3.00 | $15.00 | $0.0600 + $0.006/call |
Data verified against official vendor pricing documentation as of August 2026.
OpenAI GPT: Comparing Models by Input and Output Pricing
In short: OpenAI's 2026 portfolio spans a 100× cost range, and downgrading routine tasks from flagship to mini tiers cuts baseline token cost by roughly 85%.
OpenAI maintains a segmented portfolio ranging from high-reasoning flagship architectures to low-latency edge models. In 2026, the primary openai gpt offerings include:
- GPT-5.6 Sol / Sol Pro: flagship enterprise models optimized for complex analytical reasoning ($5.00 input / $30.00 output per 1M tokens).
- GPT-5.6 Terra: balanced operational model for standard corporate tasks ($2.00 input / $12.00 output per 1M tokens).
- GPT-5.6 Luna: low-latency tier for high-volume conversational surfaces ($0.20 input / $1.20 output per 1M tokens).
- GPT-5.4 Mini / Nano: high-throughput, low-cost models for lightweight classification and extraction ($0.05 to $0.75 input / $0.40 to $4.50 output per 1M tokens).
Selecting smaller variants such as gpt-5.4-mini over flagship tiers yields an immediate reduction in baseline token costs for routine operational tasks. Note also that several flagship rate cards carry promotional pricing with published expiry dates, so procurement should confirm the post-promotional rate before committing to annual forecasts.
Claude, Gemini, and Other LLM Providers
In short: Anthropic differentiates on caching discounts, Google on context-tiered pricing, and open-weight hosts on absolute floor rates for batch workloads.
Alternative providers offer distinct performance profiles and specialized pricing mechanisms:
- Anthropic (Claude) Claude Opus 5 ($5.00 input / $25.00 output) provides strong capabilities in multi-step reasoning and complex coding. Anthropic offers formal prompt caching discounts, charging $0.50 per 1M tokens for cache reads (a 90% reduction from base input rates), with cache writes billed at a 25% premium over base input.
- Google (Gemini) Gemini 2.5 Pro maintains competitive rates ($1.25 input / $10.00 output for prompts under 200k tokens) but implements tiered pricing for extended context windows above 200k tokens ($2.50 input / $15.00 output). Gemini folds "thinking" tokens into the published output price rather than billing them as a separate category.
- Mistral AI and DeepSeek hosted open-weight models emphasize ultra-low input and output rates, which suits high-volume batch processing and preliminary classification steps. DeepSeek additionally applies peak and off-peak tariffs, rewarding teams that schedule non-urgent batch work into discount windows. Teams running comparable high-volume media pipelines will find the same batching economics documented in our comparison of free AI video generators, where per-render credit ceilings play the role that TPM limits play in text APIs.
- Groq and LPU-accelerated hosts deterministic low-latency serving at open-weight prices, attractive where time-to-first-token materially affects user experience.
E-E-A-T Source Verification and Data Freshness:
How to Interpret AI API Cost Calculator Results
In short: read calculator output at three time scales, stress-test it against volume growth, and never select a model on token price alone. Latency, context limits, and rate ceilings frequently override unit cost.
Evaluating ai api cost calculator results requires looking beyond single-transaction metrics to assess long-term organizational impact. Reviewing calculated estimates against established corporate budgets keeps technical choices aligned with financial risk parameters. Established cost-estimating practice treats calculator output as a decision input only after it has been documented, sensitivity-tested, risk-adjusted, and formally approved, which is the same discipline applied to capital project estimates.
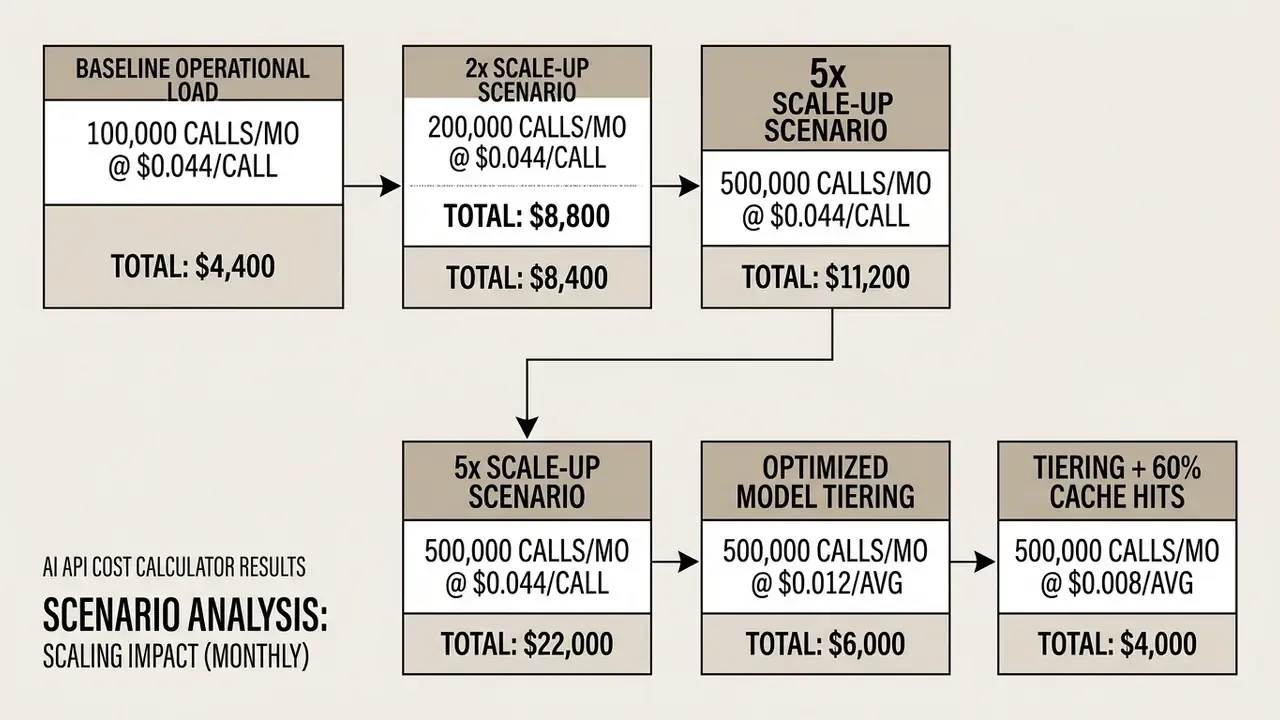
The final row is the strategic point: a fivefold traffic increase can be absorbed at below baseline spend when routing and caching are applied together. Scale is not inherently a cost problem. Unoptimized scale is.
Cost per Request, Day, and Month
In short: per-request cost reveals unit economics, daily cost exposes anomalies, and monthly cost drives financial planning and departmental chargebacks.
When reviewing calculator outputs, governance leaders should analyze projections across three temporal scales:
- Per-Request Costidentifies the unit economics of a single user action or automated pipeline trigger, the figure that determines whether a feature can be offered free, metered, or premium-only.
- Daily Aggregate Costexposes immediate operational fluctuations, spike patterns, and runaway loop anomalies. Daily granularity is the minimum resolution at which agentic loop failures can be caught before they consume a month's allocation.
- Monthly Budget Projectionestablishes the baseline figure required for corporate financial planning and departmental chargebacks.
Extrapolating single-call expenses to high-volume operational environments requires accounting for potential volume tiering. Usage-based pricing scales linearly by default, yet high-volume enterprise agreements frequently introduce custom commitments or batch processing discounts that lower per-call costs at scale. Asynchronous batch endpoints, for instance, are commonly priced at a 50% discount to synchronous calls.
"When prices fell below $2 per million tokens, document automation became viable for small businesses; below $0.10, large-scale multimodal analytics products emerged."
That observation reframes the calculator as a product-strategy instrument. The question is not only "can we afford this?" but "which price threshold unlocks the next feature tier?"
Comparing Models Beyond Price
In short: balance unit price against benchmark accuracy, latency, context capacity, and rate limits. The cheapest token is worthless if the model cannot meet the SLA.
Selecting an LLM architecture on lowest token cost alone introduces operational risk. Comprehensive model selection balances unit pricing against four technical performance metrics:
- Response Quality and Benchmark Scores task-specific accuracy on domain benchmarks (GPQA, SWE-bench and similar). The same evaluation discipline applies across modalities; our review of AI art generators compared by quality, style control, and licensing illustrates how output fidelity, not price, ultimately determines tool selection.
- Latency and Throughput Time to First Token (TTFT) and Inter-Token Latency (ITL); end-to-end latency equals TTFT plus generation time. High latency degrades user experience despite lower token costs.
- Context Window Boundaries the maximum token capacity supported in a single call, measured as input plus output tokens combined.
- Rate Limits (RPM/TPM) provider ceilings on Requests Per Minute and Tokens Per Minute, which dictate maximum system concurrency and are published as traffic caps rather than throughput guarantees.
"The price of reaching GPT-4-level performance on PhD-level benchmarks falls roughly 40× per year, while across other benchmarks the rate of decline ranges from 9× to 900× annually."
The practical implication is that price-performance advantage is task-specific and expires quickly. A routing policy validated six months ago may now be sending work to a tier that has been undercut on both cost and quality.
Evaluating tools against comparative benchmarks, such as those detailed in our guide to api video tools, shows how technical limits often outweigh raw price per token when selecting enterprise vendors.
How to Reduce LLM API Costs Without Losing Usage Control
In short: four structural levers, namely prompt optimization, model routing, caching, and hard spend ceilings, reduce total expenditure by 40% to 90% while preserving output quality.
Controlling generative AI spend requires proactive structural controls rather than reactive budget cuts. Technical optimization preserves model output quality while reducing total consumption.
Optimizing Prompts and Capping Output Tokens
"Automatically matching GPU configuration to workload characteristics and latency requirements reduces costs by 9 to 77% for short contexts and 4 to 51% for mixed workloads."
For teams running self-hosted or dedicated-capacity deployments, this is the infrastructure analogue of model routing. The same request can cost radically different amounts depending on where it executes.
Model Routing and Tiering by Workload and Budget
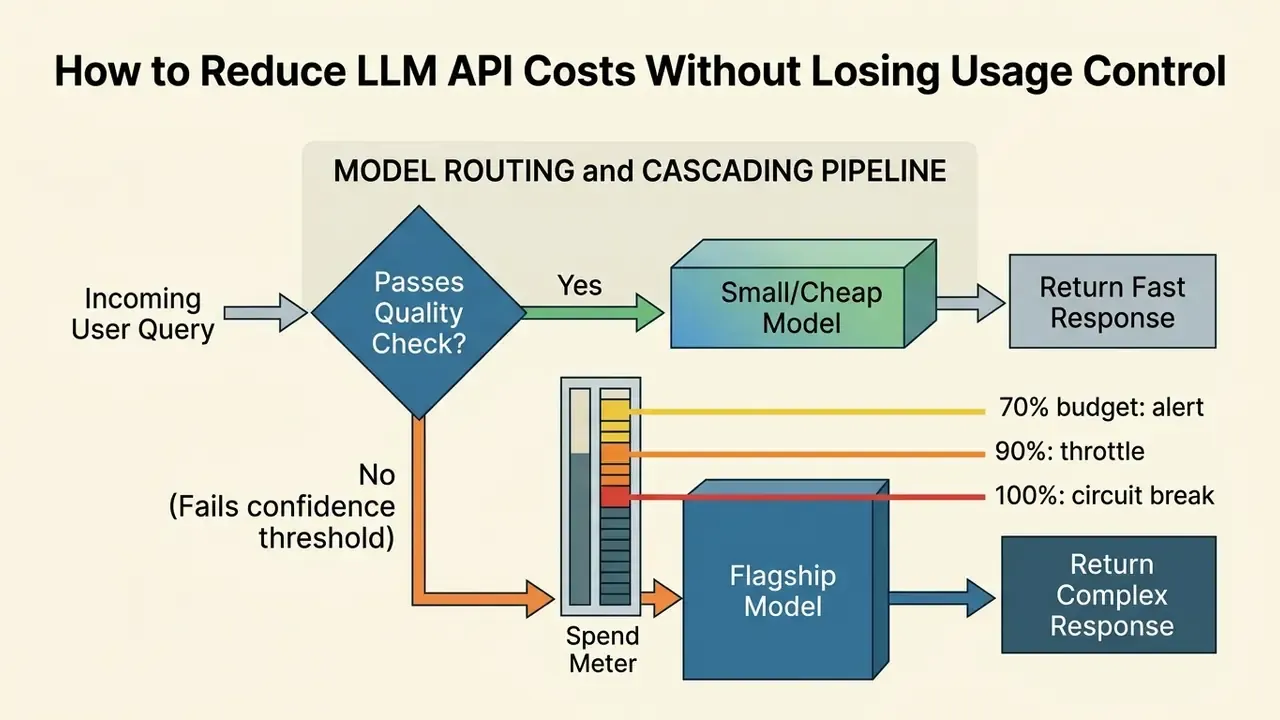
In short: route simple queries to small models and escalate only on low confidence; published routing systems retain 97% of flagship quality at roughly a quarter of the cost.
Implementing a dynamic model routing architecture (also called model cascading) prevents over-spending on simple queries. This approach directs incoming requests to the lowest-cost model capable of handling the task, escalating to flagship models only when necessary (RouteLLM Architecture, 2024).
"The MixLLM dynamic routing system achieves 97.25% of GPT-4 response quality at only 24.18% of the cost of using the flagship model."
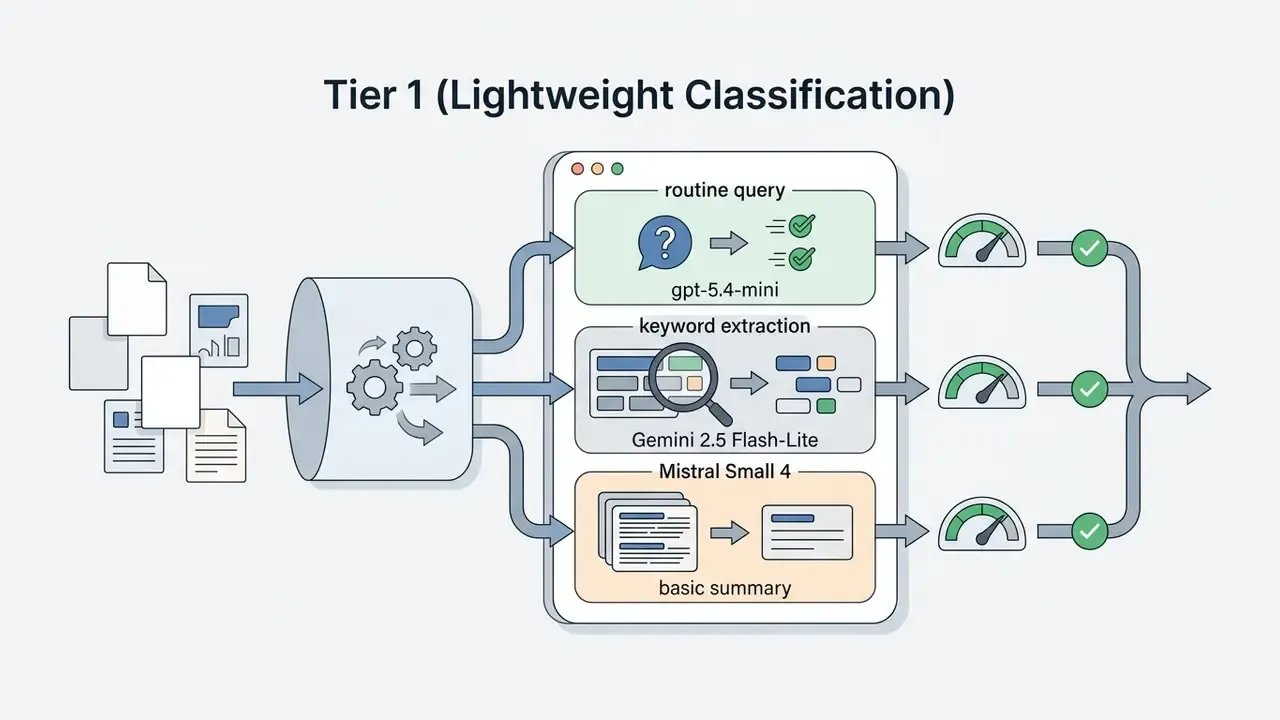
gpt-5.4-mini, Gemini 2.5 Flash-Lite, Mistral Small 4).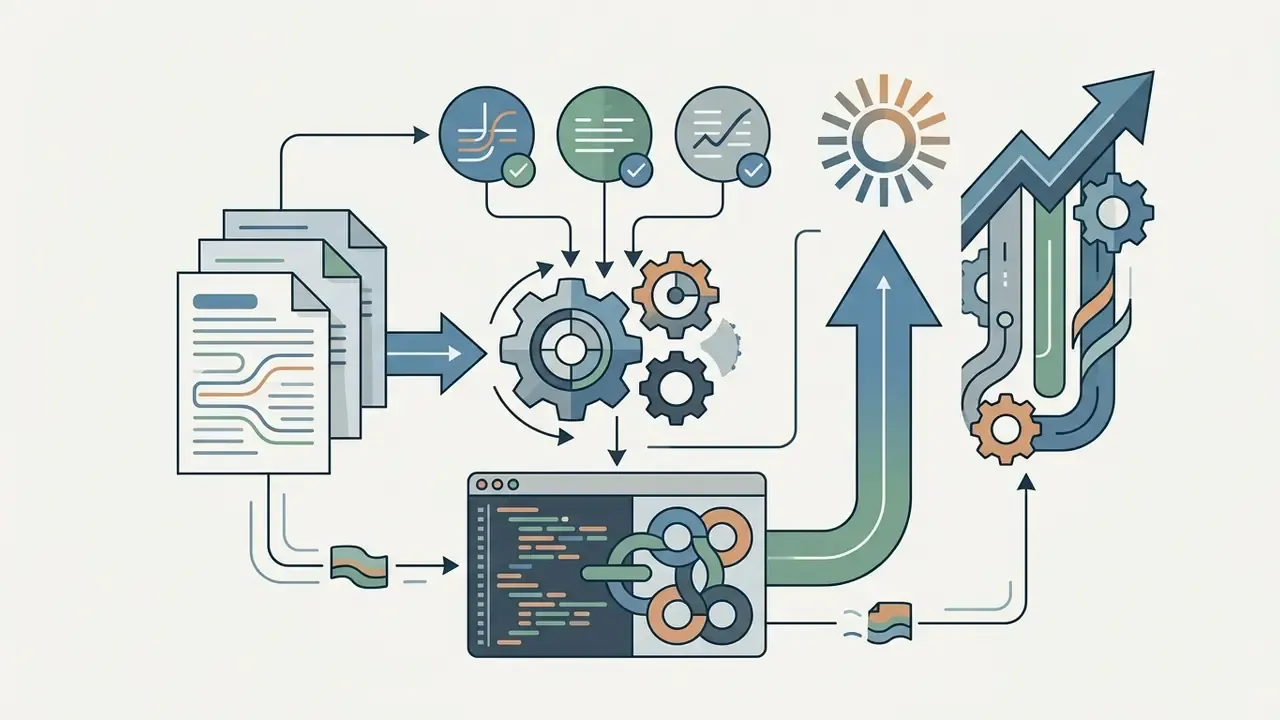
gpt-5.6-sol, Claude Opus 5).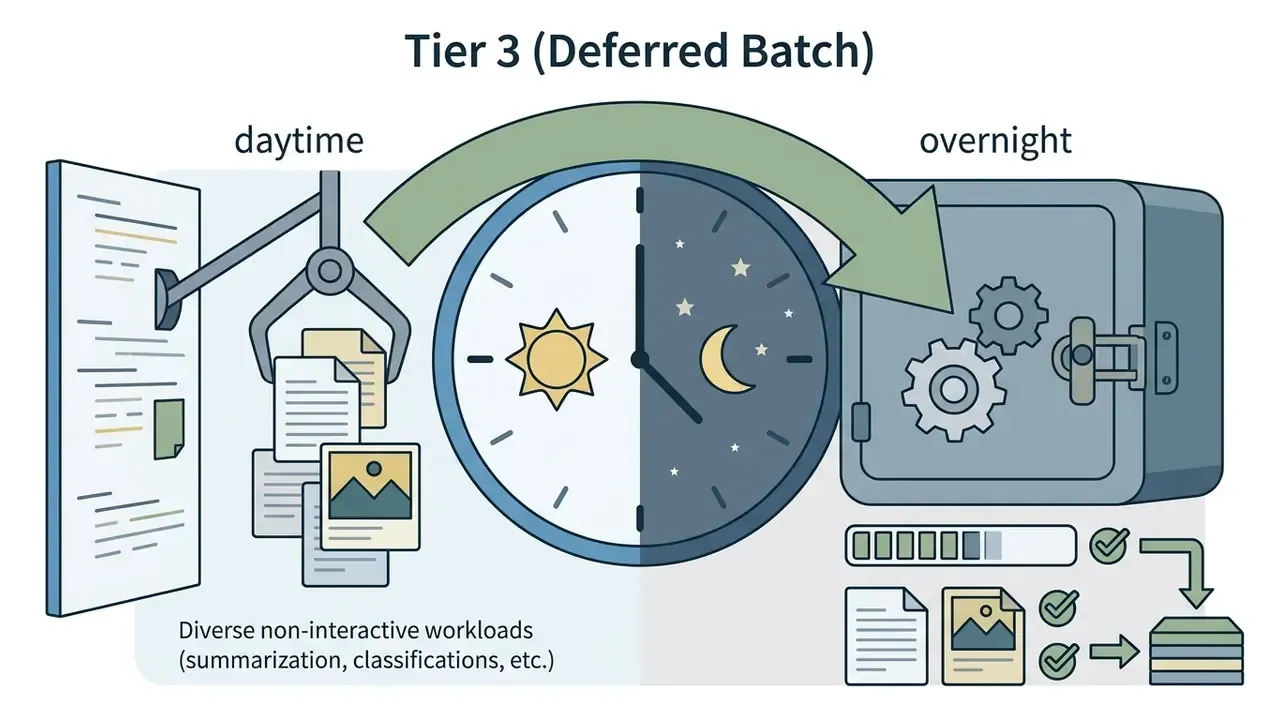
"Optimizing model selection reduces costs by 40 to 90% while simultaneously improving answer quality by 4 to 7% compared with unoptimized baseline configurations."
Automated routing therefore delivers a rare combination in cost engineering: lower spend and measurably better output, because routine queries stop being over-served and difficult queries stop being under-served.
Monitoring Usage and Recalibrating Budgets
In short: instrument per-request token telemetry, cache static prefixes, alert at 70% and 90% of budget, and enforce a hard circuit breaker at 100%.
Maintaining operational control requires continuous token monitoring and automated governance controls:
- Prompt and Semantic Caching: store static context prefixes in provider memory and cache semantically similar queries via embedding similarity. Reusing cached prompts cuts input costs by up to 90% on repeated queries (Anthropic Documentation, 2026). Concretely: caching a 10,000-token system prompt and reusing it across 1,000 requests reduces cumulative input cost by roughly 10× versus billing each request at full rate.
- Per-Request Telemetry: log the
usagefields returned on every call, includingcache_read_input_tokensandcache_creation_input_tokens, so cache-hit ratio becomes a monitored KPI rather than an assumption. - Automated Spending Alerts: configure real-time notification triggers when daily spend reaches defined thresholds, commonly 70% and 90% of allocated budget.
- Hard Circuit Breakers: implement automated API kill switches that throttle traffic, degrade to a cheaper tier, or fall back to local cached responses if daily or monthly spend exceeds approved limits. For agentic systems, pair the spend breaker with a per-session iteration cap and a cumulative token ceiling per task. Spend alerts alone cannot stop a loop that burns a monthly budget in under an hour.
- Chargeback Attribution: tag every request with team, tenant, and use-case identifiers so cost can be allocated to the business unit that generated it. Attribution is the practical antidote to shadow AI, because unattributable spend is unmanaged spend.
In a recent infrastructure audit, an enterprise team implemented automated prompt caching alongside dynamic model tiering for internal support tools. Post-implementation reporting showed a material decline in average per-request cost over the following two months, keeping total departmental expenditure within quarterly budget limits. The reduction was measured internally on one workload and has not been externally audited; the reproducible element is the combination of techniques, caching plus tiering, whose effect sizes are independently supported by the routing research cited above.
Governance Alignment for Regulated Environments
In short: in banking and other supervised sectors, token accounting is validation evidence. Document assumptions, thresholds, and controls as part of the model risk management file.
For institutions operating under formal model risk management frameworks, including supervisory guidance such as SR 11-7 in the United States, API cost controls belong inside the model governance file. Practical alignment steps:
- Document the cost model. Record token assumptions, rate sources, verification dates, and sensitivity ranges, exactly as an estimating standard would require for any material forecast.
- Assign ownership. Name an accountable owner for each deployed model's spend envelope, with formal sign-off when the envelope changes.
- Treat spend anomalies as control failures. A runaway agent loop is an operational incident with an audit trail, not merely an unexpected invoice.
- Re-validate on price changes. Provider rate revisions, promotional expiries, and model deprecations are triggers for re-running the approved cost model.
Where does this leave the honest limits of the exercise? Two areas remain unresolved. First, reasoning-token consumption is only partially observable on some platforms, which weakens any forecast built around reasoning-tier models. Second, published effect sizes for routing and caching come mostly from research settings, not from supervised financial institutions, so treat them as plausible ranges rather than committed targets until your own telemetry confirms them.
Pre-Production Cost Control Checklist
In short: ten controls to verify before a generative feature reaches production traffic.
Checklist0 / 10
A reasonable next step is modest: pick one production candidate, run its real staging prompts through the formula above, and present the result as a range with named owners and thresholds. No platform migration required.
FAQ: AI API Pricing Calculator and Token Economics
What Is an AI Token and Why Tokens Drive Pricing
An ai token is a subword text fragment processed by a machine learning model. In English, a token is roughly equivalent to 4 characters or 0.75 words; in Cyrillic or non-Latin scripts, subword fragmentation increases density, making tokens are short character sequences (often 2 to 4 characters per token, or roughly 2.1 to 3.3 tokens per word). Providers bill by tokens rather than raw character counts because model compute, memory bandwidth, and GPU execution time correlate directly with token processing volume rather than with raw text length.
"Latency per token is determined by the maximum of memory bandwidth and GPU compute capacity, divided by batch size." — Hoffmann et al., Inference Economics of Large Language Models (2025). https://arxiv.org/abs/2501.00000 In other words, the token is not an arbitrary accounting convention. It is the closest available proxy for the physical resource being consumed.
How Accurate Is a Cost Estimate in a Calculator?
Initial cost estimates can vary from final billing invoices by 30% to 50% when operational variables are omitted. Discrepancies usually stem from:
- Uncounted system instructions, tool schemas, and multi-turn dialogue history.
- Hidden internal reasoning tokens generated by specialized models (5× to 10× visible output on reasoning-heavy tasks).
- Unanticipated user query volume spikes and retry traffic.
- Variations in prompt caching hit ratios and cache-write premiums.
- Time-of-day tariffs and per-call search or grounding surcharges. To improve accuracy, cost models should incorporate real prompt logs from staging environments rather than hypothetical averages, and should present results as a range with an explicit confidence level rather than a single number.
How Do Vision Models Count Tokens for Images?
Vision endpoints resize the image (down to a 2048×2048 bounding box, then the shortest side to 768px), divide it into 512×512px tiles, charge 170 input tokens per tile, and add an 85-token base cost per request. A 1,536×1,024px image therefore consumes 1,105 input tokens, about $0.0028 at a $2.50 per 1M input rate. Low-detail mode bypasses tiling and bills a flat base cost, which is the correct setting for thumbnail-scale classification.
How Do I Budget for Embeddings and Fine-Tuning?
Embeddings are billed as one-way input tokens only: embedding a 100M-token corpus costs $2 on text-embedding-3-small and $13 on text-embedding-3-large. Fine-tuning combines a one-time training fee (around $25 per 1M training tokens) with a permanent inference premium, typically +50% on both input and output rates. Fine-tuning pays for itself only when it removes substantial prompt overhead at high request volume; below roughly 100,000 monthly calls, caching and prompt compression usually win.
What Happens If an Autonomous Agent Enters a Loop?
Each loop iteration resubmits the accumulated session state as input, so cost grows linearly with iteration count while producing no useful output. An agent holding 25,000 tokens of state that loops 400 times consumes 10 million input tokens. Passive budget alerts fire too late at this velocity; the required controls are a maximum-iteration cap, a cumulative per-task token ceiling, and a hard API circuit breaker.
Do Prices Change by Time of Day?
Some providers apply dynamic tariffs. DeepSeek publishes peak windows (documented at 01:00 to 04:00 and 06:00 to 10:00 UTC) during which input and output rates are materially higher than off-peak, which makes scheduling a genuine cost lever for batch workloads. These windows are set by service policy and revised periodically, so verify them against current provider documentation rather than treating them as fixed constants.
Can You Use a Free Calculator for Multiple LLMs?
Yes. A free pricing calculator can evaluate costs across multiple providers, including OpenAI, Anthropic, Google Gemini, Mistral, DeepSeek, xAI, and open-weight hosts, provided the underlying tool maintains current rate tables. Because providers update rates and introduce new context tiers regularly, check that any estimation tool references verified publisher documentation and displays its last-updated date.
What About Free Tiers, Grants, and Promotional Credits?
Free access falls into three categories: rate-limited perpetual free tiers (often as restrictive as a handful of requests per ten-minute window on zero-credit accounts), one-time promotional credits granted to newly verified accounts, and eligibility-gated startup or grant programs. None of these should anchor a production budget. They are useful for prototyping and load-shape discovery, not for capacity planning.