Executive summary for risk, compliance and model governance leaders
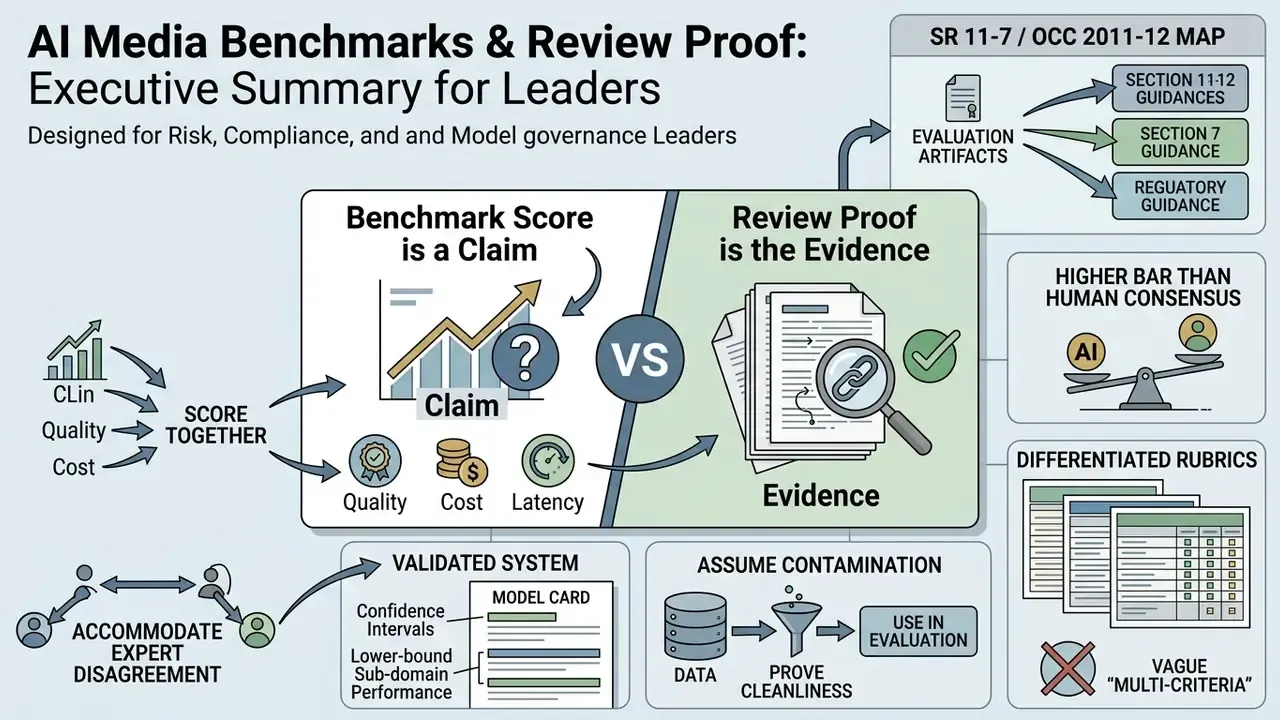
- A benchmark score is a claim; review proof is the evidence. A public leaderboard number tells you what a model achieved once, under conditions you did not control. Review proof documents the dataset, prompts, decoding parameters, human adjudication and raw logs that make the number defensible in front of an internal audit function or an examiner.
- Map every evaluation artifact to SR 11-7 / OCC 2011-12. US banking supervisors expect three pillars for any model in use: conceptual soundness, ongoing monitoring, and outcomes analysis. Benchmark selection maps to conceptual soundness, telemetry and drift alerts map to ongoing monitoring, and private-dataset back-testing maps to outcomes analysis.
- Hold AI to a higher bar than a two-reviewer human consensus. Human errors are distributed and idiosyncratic; AI errors are systematic and replicate across the whole population of records. Deployment thresholds must therefore be set on the lower bound of performance at a 95% confidence interval, not the mean.
- Score quality, cost and latency together. Accuracy alone conceals the true economics of production. Track cost per usable output, time-to-first-token or frame, and throughput per dollar beside accuracy, or you will approve a model whose hallucination-filtering overhead quietly exceeds its labour savings.
- Use differentiated rubrics, not vague "multi-criteria" scoring. Assign each requirement a weighted value from −10 (compliance breach, hallucinated term) to +10 (fully accurate, correctly toned), then normalise against the maximum attainable positive score.
- Accommodate legitimate expert disagreement. For textual critique, summarisation and contract review, use a Max-Recall alignment strategy on atomic claims, so a valid insight raised by only one senior reviewer is not scored as a false positive.
- Assume contamination until proven otherwise. Verbatim overlap with web-scale crawl corpora inflates measured performance by roughly 1% to 45.8%. Enforce a temporal data cutoff after the model's training cutoff, and audit leakage before you compare vendors.
- Publish a model card per validated system, with confidence intervals, lower-bound performance by sub-domain, contamination-audit results and known limitations, then re-validate on a defined cadence rather than at procurement only.
About this guidance. This article is maintained by the AI Governance & Model Risk editorial desk for chief risk officers, chief compliance officers, heads of model risk and AI governance leads in US banks, insurers and mature fintechs. Editorial review focus: model risk management (SR 11-7 / OCC 2011-12), NIST AI RMF alignment, and multimodal evaluation methodology. Vendor-independence statement: the methodology described here is platform-neutral and is not sponsored by, affiliated with, or optimised for any specific model provider (OpenAI, Anthropic, Google, Meta, Mistral, Amazon or otherwise).
Scope of this guidance. The argument moves from what benchmarks and review proof actually show, through evaluation methodology and the artifacts that qualify as verifiable evidence, into how to read results and compare vendors under matched conditions. It then covers structural benchmark limitations, a continuous evaluation strategy with the total cost of governance attached, a selection checklist, a staged next-step plan, and answers to the questions that surface most often in model risk committees.
Enterprise adoption of generative AI, multimodal systems, and digital agents across US financial services and regulated corporate operations hinges on one operational transition: moving from informal technology pilots into controlled, auditable production environments. As executive teams evaluate model deployments for document intelligence, media processing, automated customer communications, and financial workflow automation, public leaderboards and vendor capability claims often create a false sense of security. Relying on aggregate accuracy scores without inspecting the underlying testing methodology introduces severe model risk, data privacy vulnerabilities, and governance compliance failures.
For US banking institutions, this is not an abstract engineering preference. Federal Reserve and OCC supervisory guidance on model risk management (SR 11-7 / OCC Bulletin 2011-12) requires that every model in use be supported by evidence of conceptual soundness, ongoing monitoring, and outcomes analysis, with effective challenge from parties independent of model development. A vendor benchmark PDF satisfies none of those three requirements on its own.
The problem intensifies with agentic AI, where a model does not merely produce a draft but calls tools, retrieves records, and takes sequential actions inside a financial control environment. In agentic pipelines, one upstream misreading propagates into downstream decisions. So evaluation must measure trajectory integrity and tool-call correctness, not final-answer accuracy alone.
To make risk-adjusted procurement and deployment decisions, risk executives need to understand what ai media benchmarks and review proof reveal, how evaluation frameworks are constructed, and how to verify the evidence chain supporting model performance claims.
What AI media benchmarks and review proof show
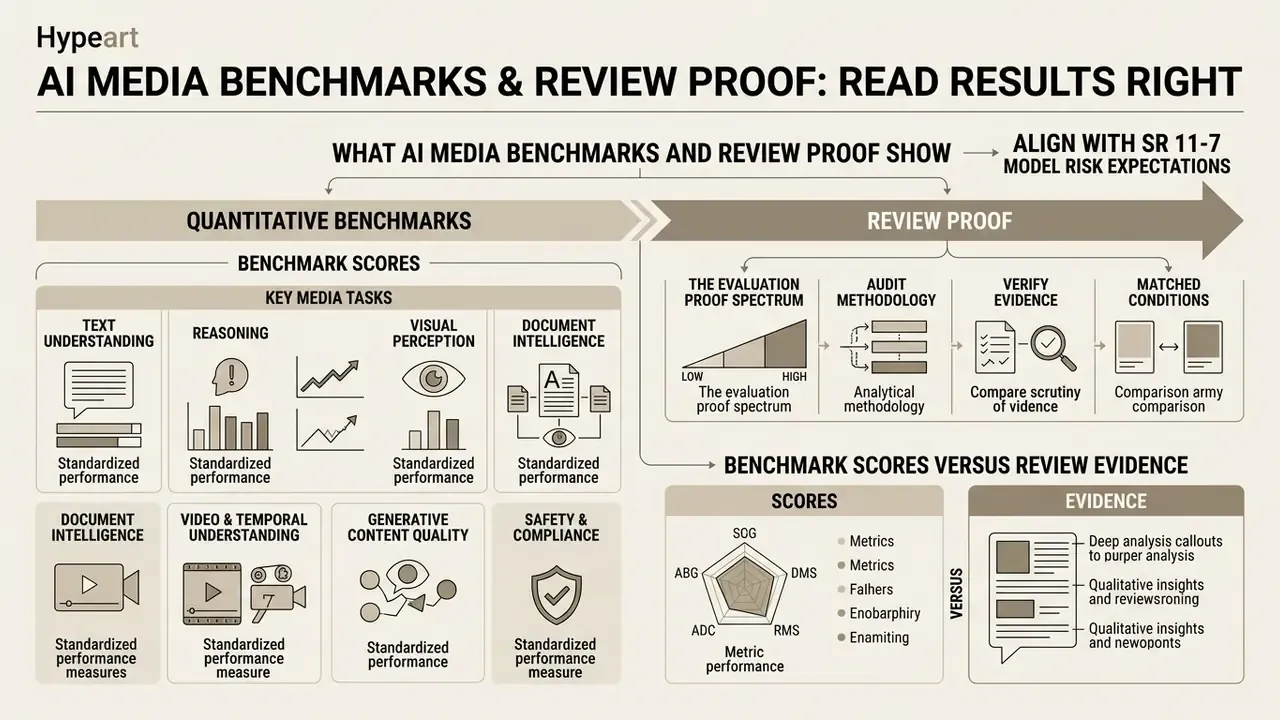
AI media benchmarks measure quantitative performance across standardized task sets. Review proof provides qualitative, auditable verification that test methodologies, dataset labels, and system behaviors hold up under real-world operational conditions. In enterprise risk management, a benchmark score is a single data point generated under specific laboratory settings; it demonstrates what a model can do in a controlled test.
«Benchmarks are best read as structured experiments that measure specific behaviours under controlled conditions; results are interpretable only in light of the task definitions, datasets and evaluation protocols used.»
The evaluation proof spectrum
| Quantitative scores | Qualitative review | Verifiable evidence |
|---|---|---|
| Accuracy and Hit@1 | Expert methodology audit | Open test code (MIT / Apache 2.0) |
| BLEU, ROUGE, Elo | Human preference scoring | Raw output logs with version IDs |
| Task completion rate | Failure-mode analysis | Data provenance and licensing |
| Cost per usable output, latency | Reviewer credentials and IRR | Contamination-audit results |
| "What the model achieved" | "How quality was judged" | "Proof that it is real" |
Which media tasks should a benchmark represent?
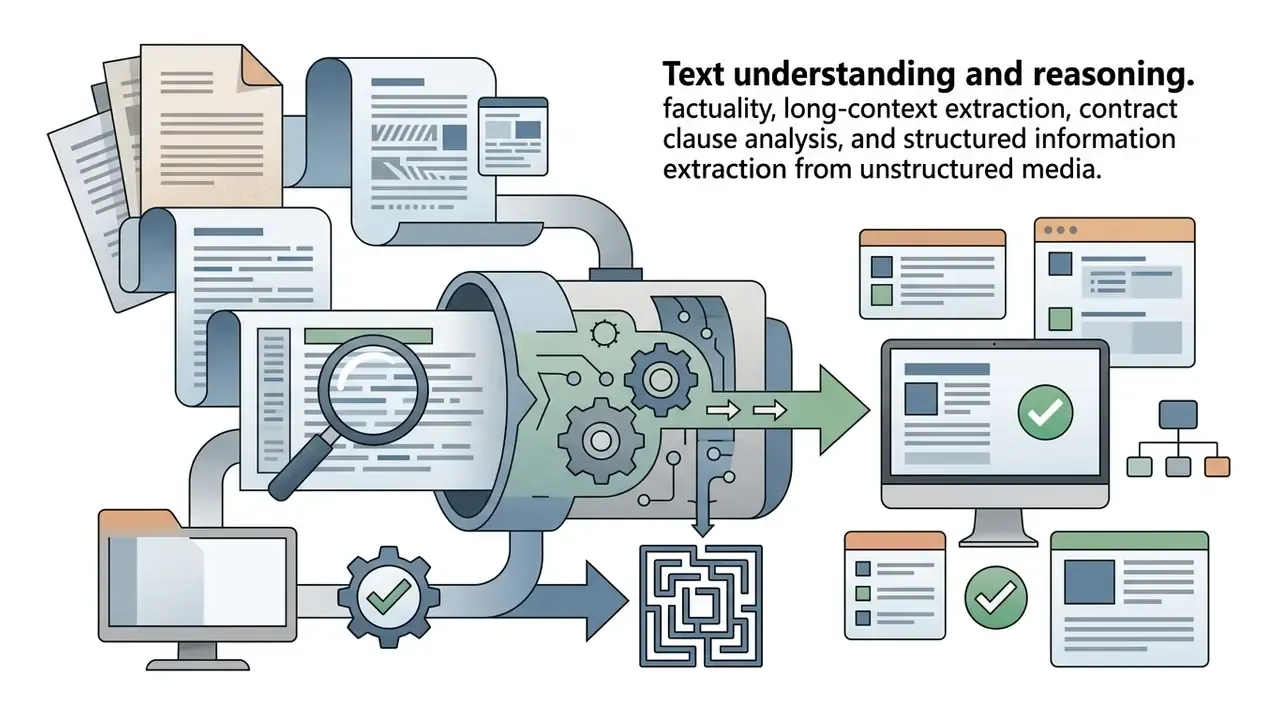
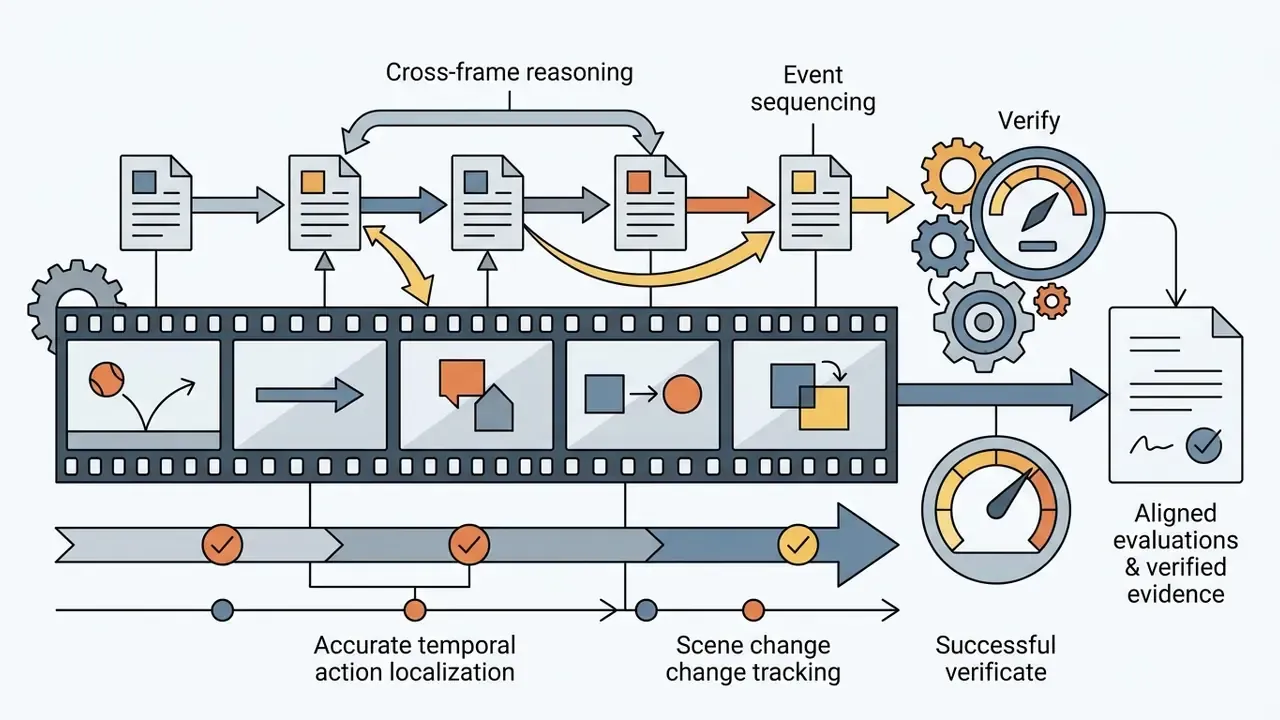
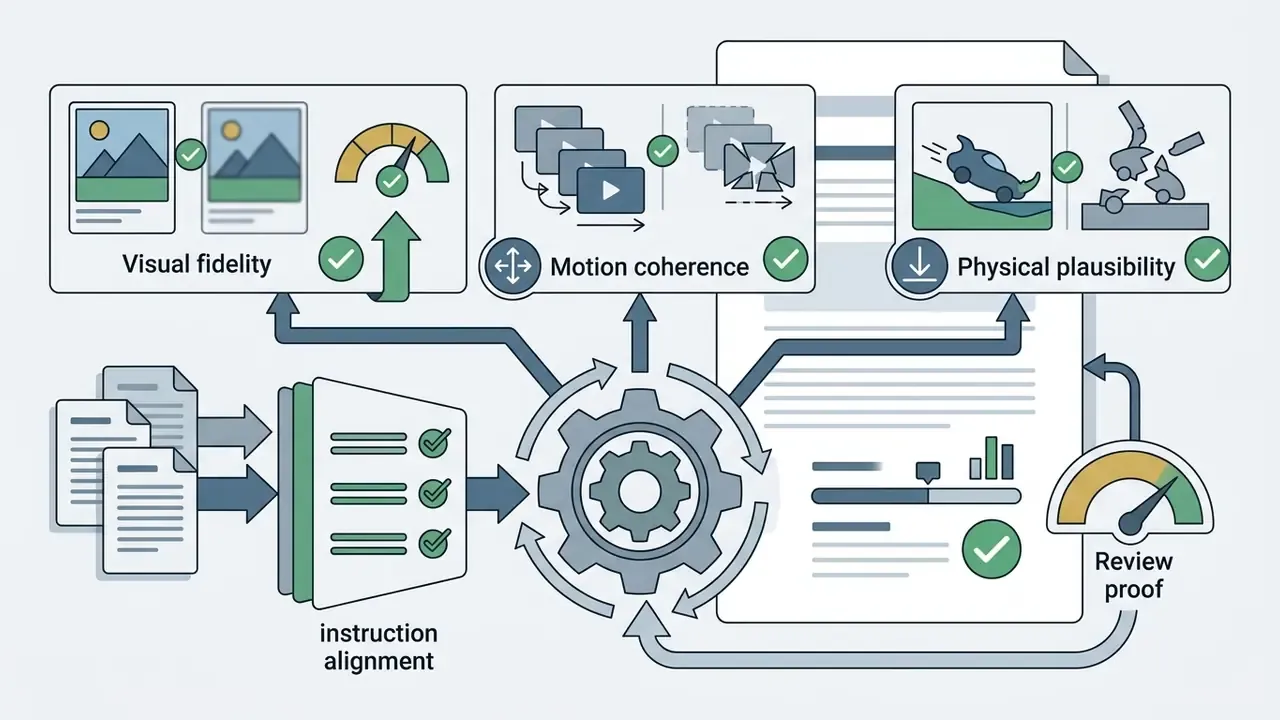
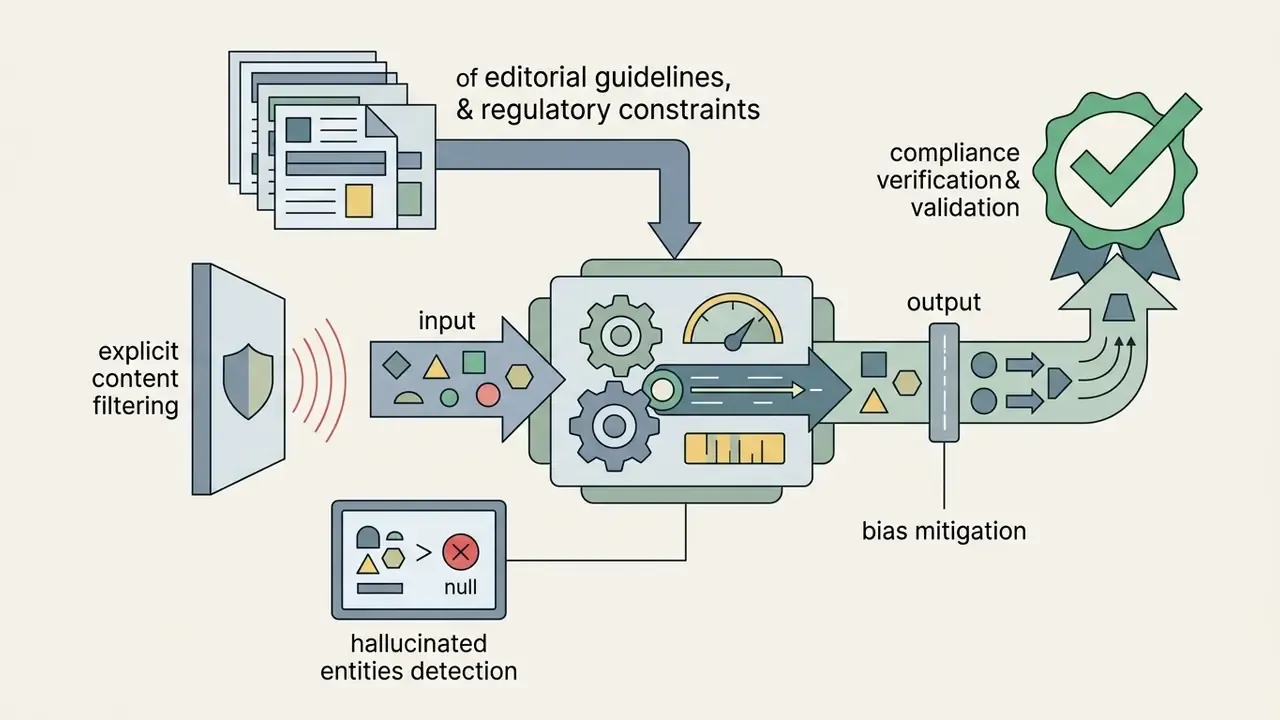
A representative media benchmark must evaluate unit tasks that mirror actual operational workflows across text, visual, and temporal modalities. In enterprise media processing, testing isolated capabilities such as single-frame image classification or short-text summarization fails to capture the complexity of multi-step business workflows. A robust evaluation framework incorporates test units across five core task categories:
«MVBench deliberately targets 20 challenging video tasks that "cannot be effectively solved with a single frame", converting static image tasks into dynamic temporal ones.»
A sixth category is increasingly mandatory for agentic deployments: workflow and tool-use integrity, covering retrieval grounding, tool-call schema conformity, multi-turn state retention, and graceful abstention when the required evidence is absent from the source document.
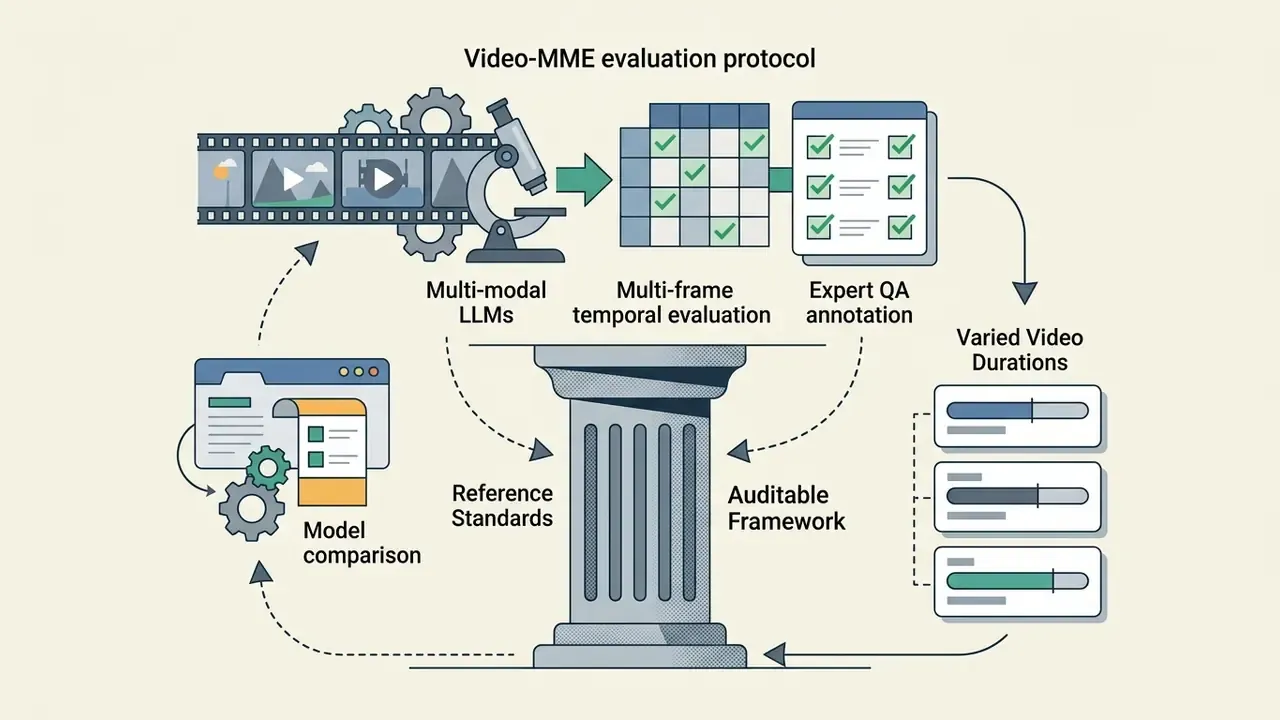
The Video-MME benchmark illustrates this multi-dimensional approach by defining a full-spectrum video-analysis suite spanning six visual domains, 30 subfields, and video lengths from 11 seconds to one hour. Similarly, multi-modal evaluations such as MMEB-V2 assess unified embedding models across 78 downstream tasks. The lesson is consistent: enterprise media evaluation has to cover both task performance and visual-perceptual quality.

Benchmark scores versus review evidence
Benchmark scores compress multi-dimensional model behaviors into a scalar number. Review evidence documents the qualitative methodology, annotation standards, and error boundaries behind those scores. A model achieving 90% accuracy on a public test suite may look superior on paper, but model risk leaders have to interrogate the remaining 10%. If those failures involve catastrophic hallucinations, regulatory compliance breaches, or data privacy leaks, the model stays unviable for production deployment.
| Dimension | Benchmark scores | Review evidence |
|---|---|---|
| Primary focus | Quantitative task completion | Methodological integrity |
| Output format | Scalar metrics (for example 88.5%) | Auditable documentation |
| Diagnostic value | Initial screening and ranking | Production risk defense |
| Error visibility | Conceals failure severity | Maps specific edge cases |
| Human involvement | Automated evaluation scripts | Expert panel verification |
| Regulatory weight | Marketing-grade support | SR 11-7 effective-challenge evidence |
«HELM evaluates 30 language models across 42 scenarios on accuracy, calibration, robustness, fairness, bias, toxicity and efficiency, reaching 87.5% coverage of scenario-metric pairs.»
High-quality benchmarks are themselves rated across structural validity, external validity, reliability and correctness over the whole evaluation lifecycle, rather than judged solely on automated output scoring. That is the approach formalised in Stanford HAI's What Makes a Good AI Benchmark? / BetterBench assessment (2024), which scores benchmarks against 46 criteria across five lifecycle phases. Qualitative review evidence, in turn, incorporates double-blind human annotations, inter-rater reliability metrics, and explicit domain-expert sign-offs. For procurement teams evaluating automated processing tools, obtaining a thorough review proof is what confirms that reported benchmark gains survive internal model risk validation.
Scoring textual critique when experts disagree: the Max-Recall strategy
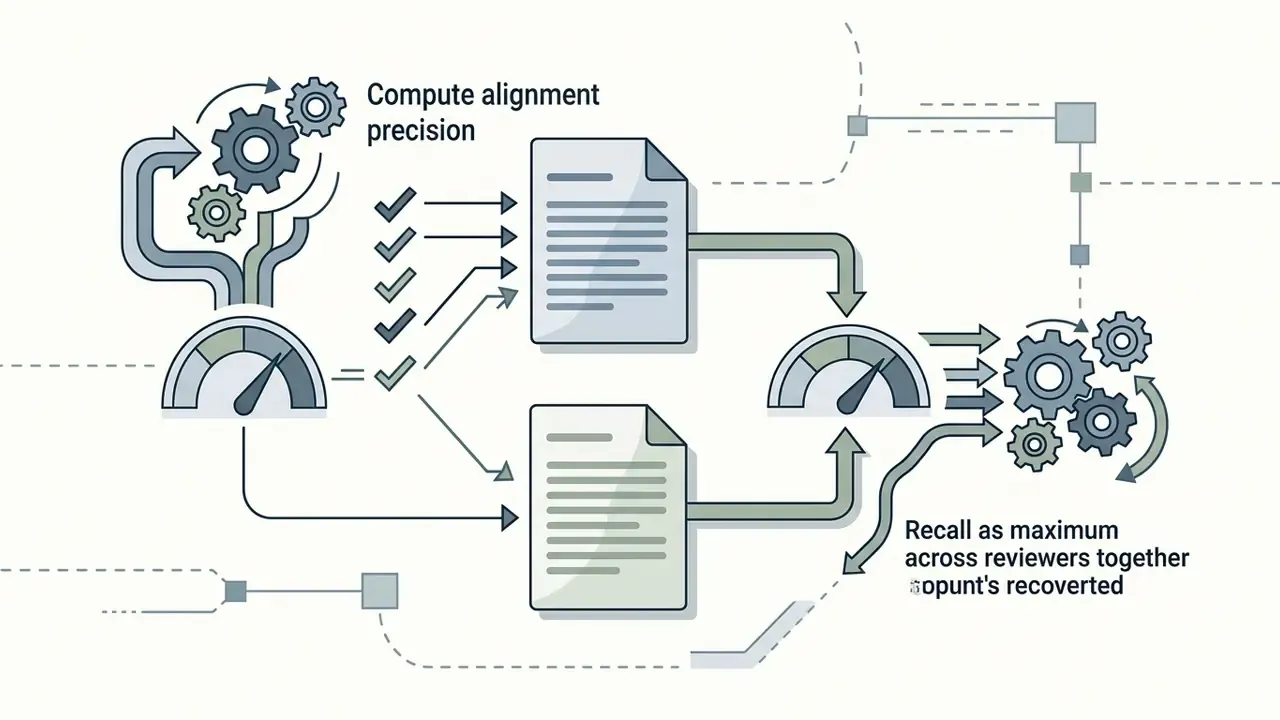
When the evaluated output is a textual judgement, such as a contract review, an audit finding, a credit memo critique or a document summary, demanding that the AI response match every human reviewer simultaneously is methodologically wrong. Qualified experts legitimately diverge in focus. Apply a Max-Recall alignment protocol instead:
This removes the penalty for deep findings noticed by only one senior auditor, while still punishing invented critiques. It also produces a defensible score in the common situation where inter-rater agreement among humans is itself below 0.8.
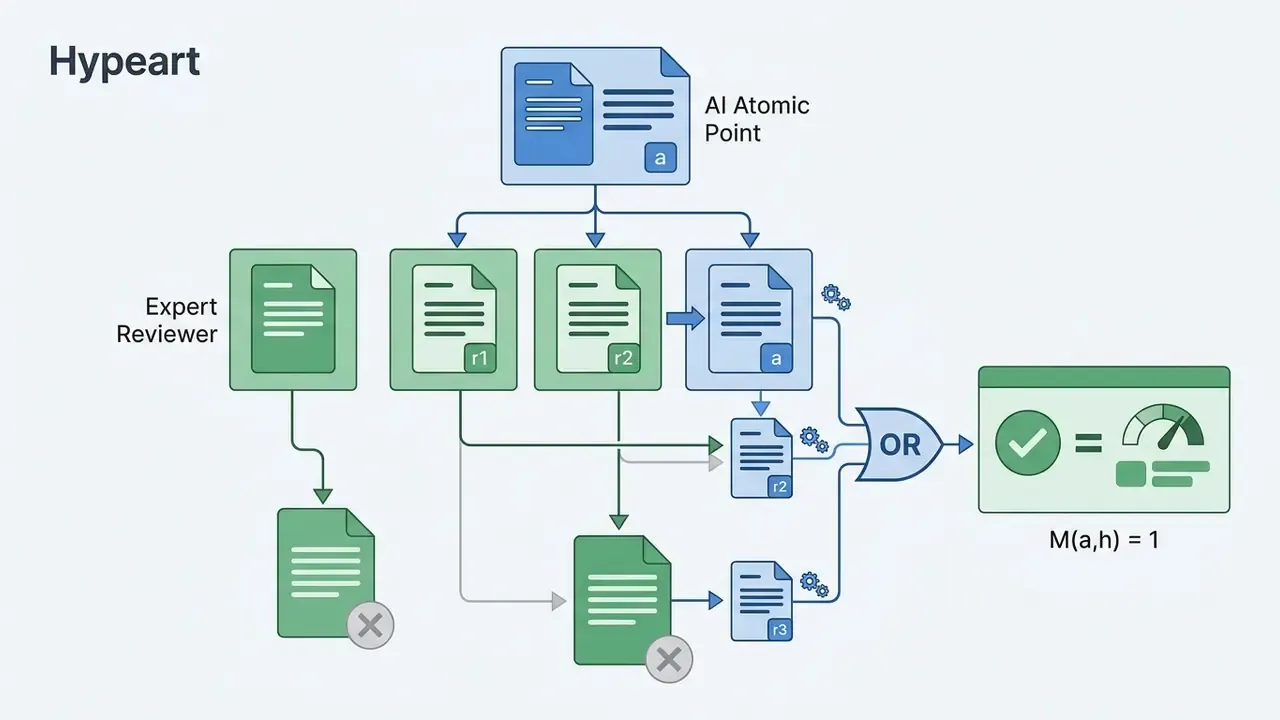
«Requiring an AI agent to encompass the union of all human critiques is often impractical; a high-quality review should demonstrate deep alignment with at least one expert's perspective.»
The same research shows that traditional n-gram metrics fail to reflect human preferences on open-ended critique, whereas recall of weakness arguments correlates strongly with rating accuracy. Read that as a direct argument against using BLEU or ROUGE as a gate for review-style outputs.
AI media benchmarks and review proof methodology
Building an enterprise-grade evaluation framework requires a disciplined, repeatable process. The ai media benchmarks and review proof methodology must keep test conditions constant across evaluation runs, standardize prompts, and construct datasets in a way that prevents biased or misleading outcomes.
| Stage | Action | Primary artifact produced |
|---|---|---|
| 1. Define goals | Set intended use, risk thresholds, materiality tiers | Evaluation charter |
| 2. Dataset curation | Sanitize, filter, apply temporal cutoff, split | Dataset card and provenance log |
| 3. Prompt standardization | Freeze templates, system messages, few-shot sets | Prompt registry |
| 4. Execution and scoring | Run metrics plus latency, cost and quality checks | Raw logs and score files |
| 5. Expert review | Dual-blind adjudication, override logging | Reviewer notes and IRR statistics |
| 6. Audit evidence | Publish model card, code, variance reporting | Auditable evaluation package |
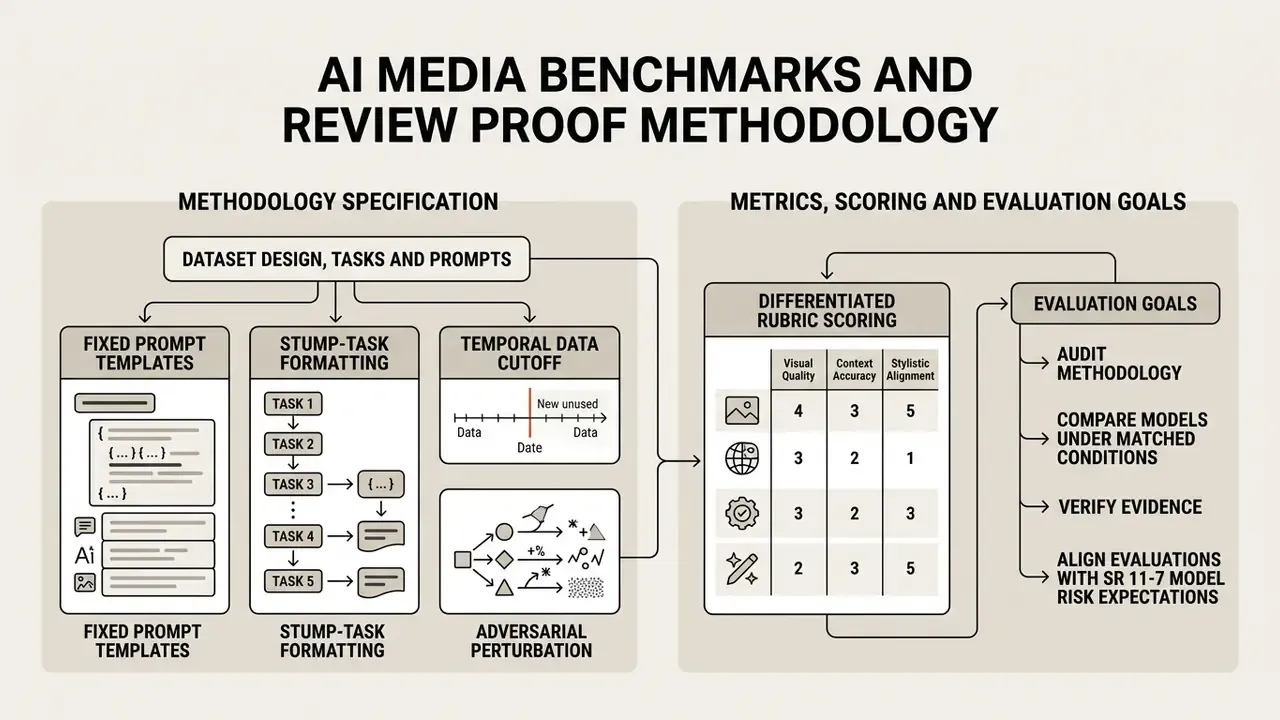
EVALUATION PROCESS METHODOLOGY SPECIFICATION
Dataset design, tasks and prompts
Robust dataset design means selecting test items that reflect operational real-world data distributions while guarding against artificial simplicity.
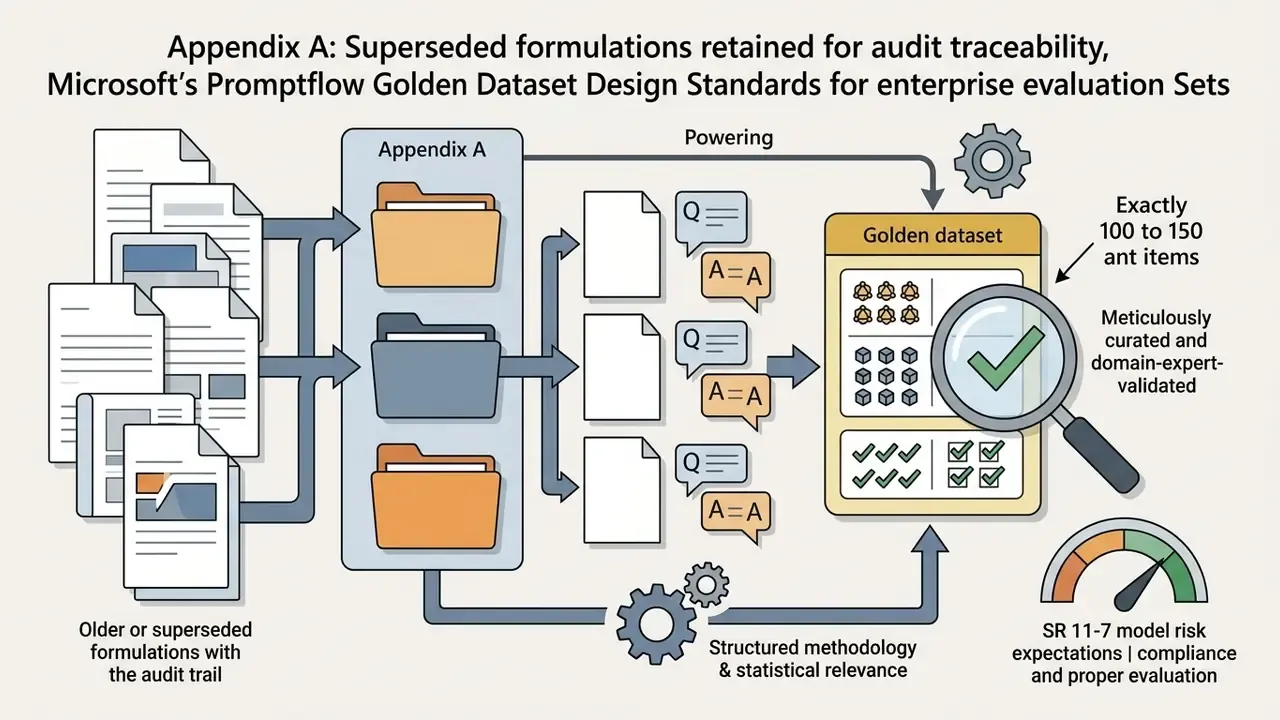
Practitioner guidance on "golden dataset" construction, including Microsoft's Promptflow evaluation documentation, converges on a working range of roughly 100 to 150 realistic, domain-expert-validated question and answer pairs per task family. Enough for statistical relevance, small enough to keep expert curation and second-pass QA affordable. Treat this as a practitioner heuristic, not a regulatory minimum, and size the set upward whenever your production population contains distinct sub-domains with different failure profiles. Each sub-domain needs enough items to compute its own lower bound.
«URS collected 1,846 real-world LLM use scenarios from 712 participants across 23 countries, spanning interactions with 15 different language models and 7 user-intent types.»
Dataset construction guidelines require four methodological safeguards:
- Fixed prompt templates. Prompts must be frozen across all test runs. Modifying system prompts or few-shot examples mid-evaluation invalidates cross-model comparisons.
- Stump-task formatting. As demonstrated in the Humanity's Last Exam (HLE) benchmark published in Nature, multiple-choice and exact-match questions should be built to stymie models relying on superficial pattern matching, forcing genuine multi-step reasoning.
- Adversarial perturbation. Frameworks like PromptBench introduce controlled prompt attacks and dynamic variable alterations to test whether performance collapses under minor phrasing variations.
- Temporal data cutoff. Every evaluation item should originate from documents, transactions, or media created after the candidate model's published training-data cutoff, or from private records that never appeared on the public web. Where a temporal cutoff is impossible, run an explicit contamination audit (n-gram overlap and perplexity signals) and record the result in the dataset card. Personally identifiable and regulated data must be de-identified before any third-party API is used for evaluation, and the evaluation environment must sit under the same data-residency and retention controls as production.
Metrics, scoring and evaluation goals
Metric selection has to align directly with the organization's governance and operational objectives. Relying on a single aggregate metric creates dangerous blind spots, because different metrics measure structurally different dimensions of model output:
| Metric | Primary measurement focus | Operational blind spot |
|---|---|---|
| Accuracy | Exact match correctness | Misses partial semantic correctness and nuance |
| BLEU / ROUGE | Surface n-gram overlap with reference text | Fails on paraphrasing, synonyms, and coherence |
| Elo rating | Pairwise preference ranking from head-to-head battles | Sensitive to prompt order and non-transitive loops |
| Multi-criteria rubrics | Multi-dimensional rating across specific capabilities | Requires calibrated judge standards and weighted point values |
| Cost per usable output | Compute or API cost spent to generate one error-free production asset | Ignores initial latency; requires automated validation guardrails |
| Time-to-first-token or frame (TTFF) latency | Delay from query dispatch to first returned token or frame | Does not reflect total completion time for ultra-long context |
| Token or frame throughput per dollar | Processed frames or tokens per second per unit of infrastructure spend | Conceals degradation in visual-reasoning quality under high compression |
| Recall (sensitivity) | Share of everything that had to be found which was found | High recall can coexist with unusable precision on single-value fields |
| Precision | Share of flagged or suggested items that were correct | Plausible-but-wrong suggestions get accepted without challenge |
Recall matters most where the critical failure is a missed item, for example screening out a relevant document. Precision matters most for single-value extraction fields such as counterparty, jurisdiction or notional amount, where a plausible incorrect value is silently accepted downstream. Multi-value fields (funders, obligations, covenants) require both.
«HELM explicitly pairs each scenario with a metric set, recognising that models can improve accuracy while increasing toxicity or degrading calibration.»
Differentiated rubric scoring. To remove abstraction from "multi-criteria" evaluation, enterprise systems should adopt weighted rubric scales in the style of physician-designed rubrics used by HealthBench. Each criterion receives a point value on a range from −10 (critical failure: hallucinated term, compliance breach, unsafe advice) through 0 (neutral) to +10 (fully accurate, complete, correctly toned). The task score is normalised:
A worked example for an automated commercial-loan summary:
| Criterion | Type | Weight |
|---|---|---|
| States the correct facility amount and currency | Positive, essential | +10 |
| Identifies all financial covenants present in the document | Positive, essential | +8 |
| Flags missing information instead of inferring it | Positive, desired | +5 |
| Maintains neutral professional tone | Positive, stylistic | +2 |
| Omits a material covenant | Negative | −8 |
| Invents a term not present in the source | Negative, critical | −10 |
| Discloses restricted PII in the summary | Negative, critical | −10 |
Any single criterion scoring −10 should trigger an automatic task failure regardless of the normalised score, so that averaging cannot dilute a compliance breach. One control, one line, enormous downstream value.
Surface-overlap metrics such as BLEU and ROUGE do not measure semantic validity, logical coherence or factual accuracy. NIST's assessment of automatic machine-translation metrics notes that they have not consistently predicted usefulness, adequacy, or reliability, and that n-gram overlap breaks down on synonymy, paraphrase and coherence (NIST AI Risk Management Framework, 2023; https://nvlpubs.nist.gov/nistpubs/ai/NIST.AI.100-1.pdf). An output can post a high ROUGE score by echoing reference keywords while completely reversing the legal meaning of a critical financial clause.
Human and expert review in AI evaluations
Human and expert review provides the validation layer for complex, context-dependent media outputs that automated scripts cannot evaluate accurately. Regulatory bodies, including the UK Information Commissioner's Office (ICO) and the German Research Foundation (DFG), explicitly require that automated scoring be complemented by documented human oversight when assessing high-risk AI deployments. The World Health Organization's 2025 framework for evidence generation on AI-based devices goes further, requiring independent peer review of output data before evidence is accepted.
Operationalizing human review means establishing rigorous annotation protocols:

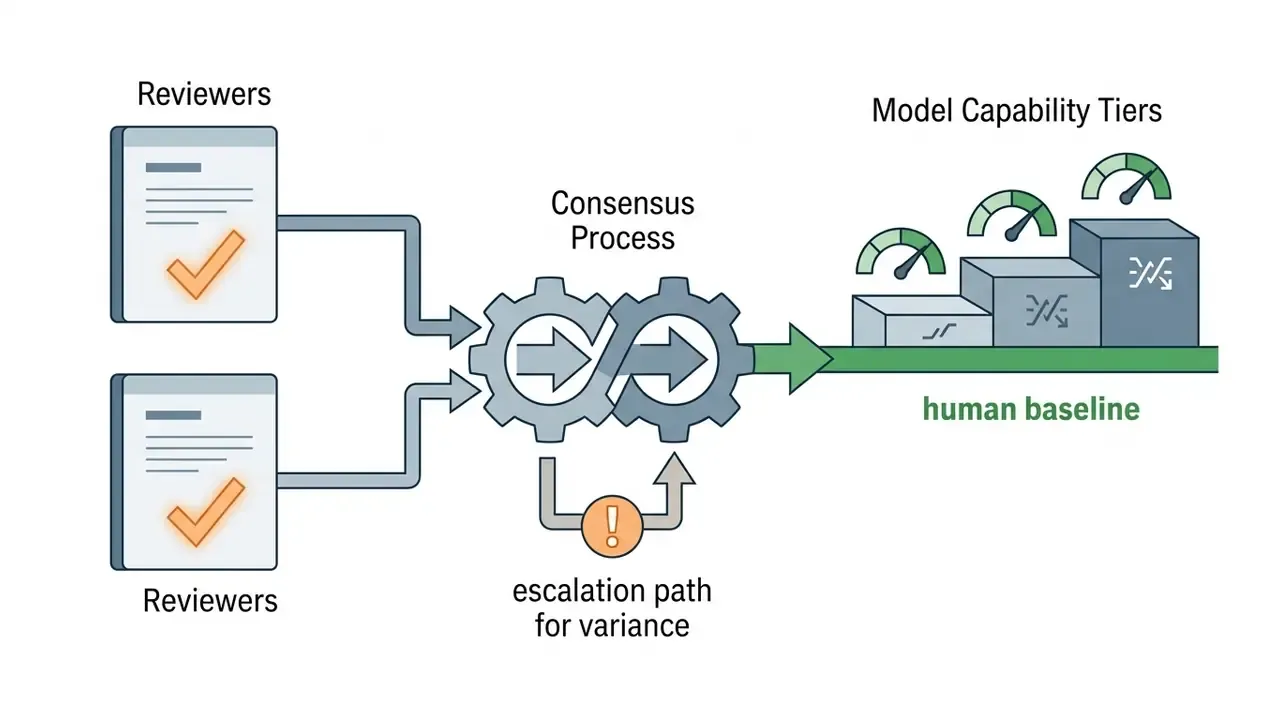

Why AI must clear a higher bar than the human baseline
When designing expert consensus, account for the structure of errors, not only their rate. Human errors tend to be varied and distributed, and independent double review mitigates them. AI errors are typically systematic: the same misunderstanding repeats across thousands of records, so a small measured error rate can concentrate into a single correlated, portfolio-level exposure.
For that reason the deployment threshold must be the lower bound of performance at a 95% confidence interval, not the mean. If a model shows 90% mean accuracy overall but its lower bound falls to 62% on complex, inconsistently formatted contracts, and those same contracts are the ones most likely to change a credit decision, the model is not eligible for automated deployment on that segment. Whatever the aggregate figure says. Higher levels of autonomy therefore require progressively stronger evidence:
| Autonomy level | Human oversight | Required performance evidence |
|---|---|---|
| Suggestion only | Human decides every item | At or near human baseline on the mean |
| Human-in-the-loop | Human reviews every output | Lower bound ≥ human baseline on all material sub-domains |
| Human-on-the-loop | Sampled review plus exception queues | Lower bound above human baseline, with drift alerts |
| Full automation | Post-hoc audit only | Lower bound materially above human baseline, plus documented consequence-of-error analysis |
«It is the lower bound of performance, not the mean, that determines whether a model is safe to use.»
What counts as review proof and verifiable evidence
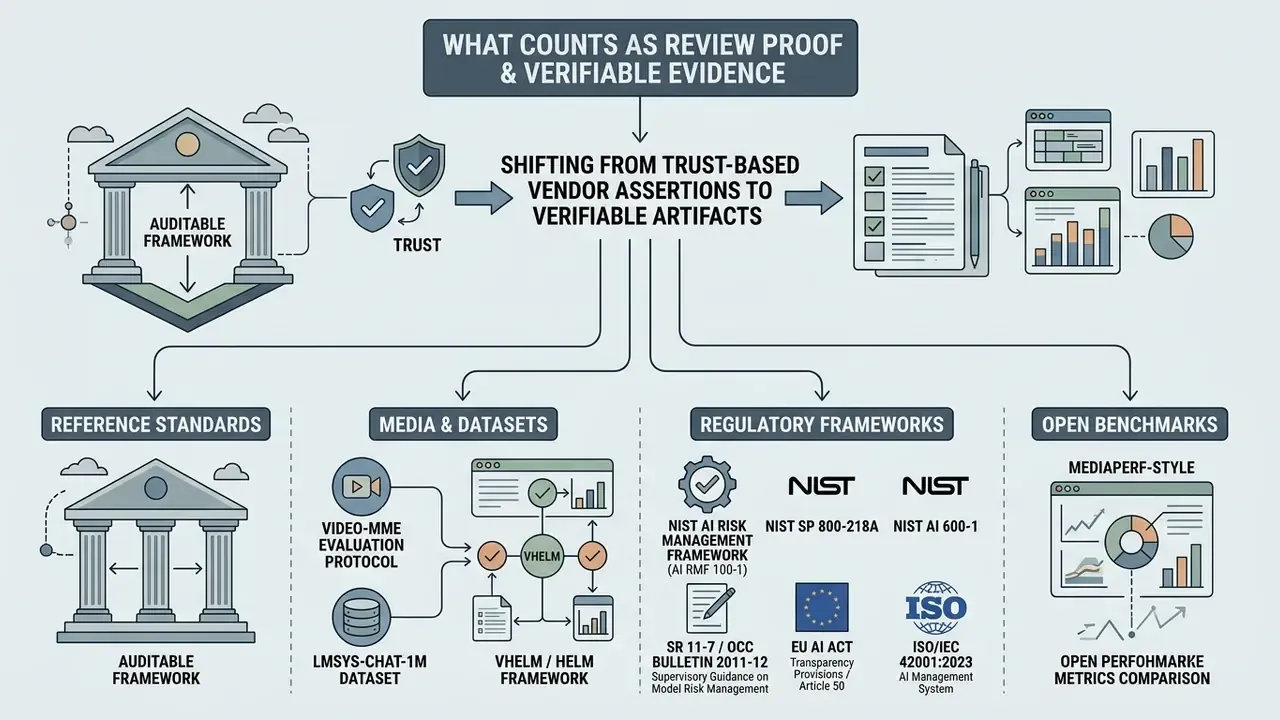
Evaluating ai media benchmarks and review proof evidence means shifting from trust-based vendor assertions to verifiable artifacts. Model governance teams should demand complete access to raw test data, generation logs, and code repositories before certifying an AI system for operational deployment. NIST defines validation as "confirmation, through the provision of objective evidence" that intended-use requirements are met. Which means an unverifiable claim carries zero validation weight, however impressive the headline number.
Reference standards to anchor an auditable framework
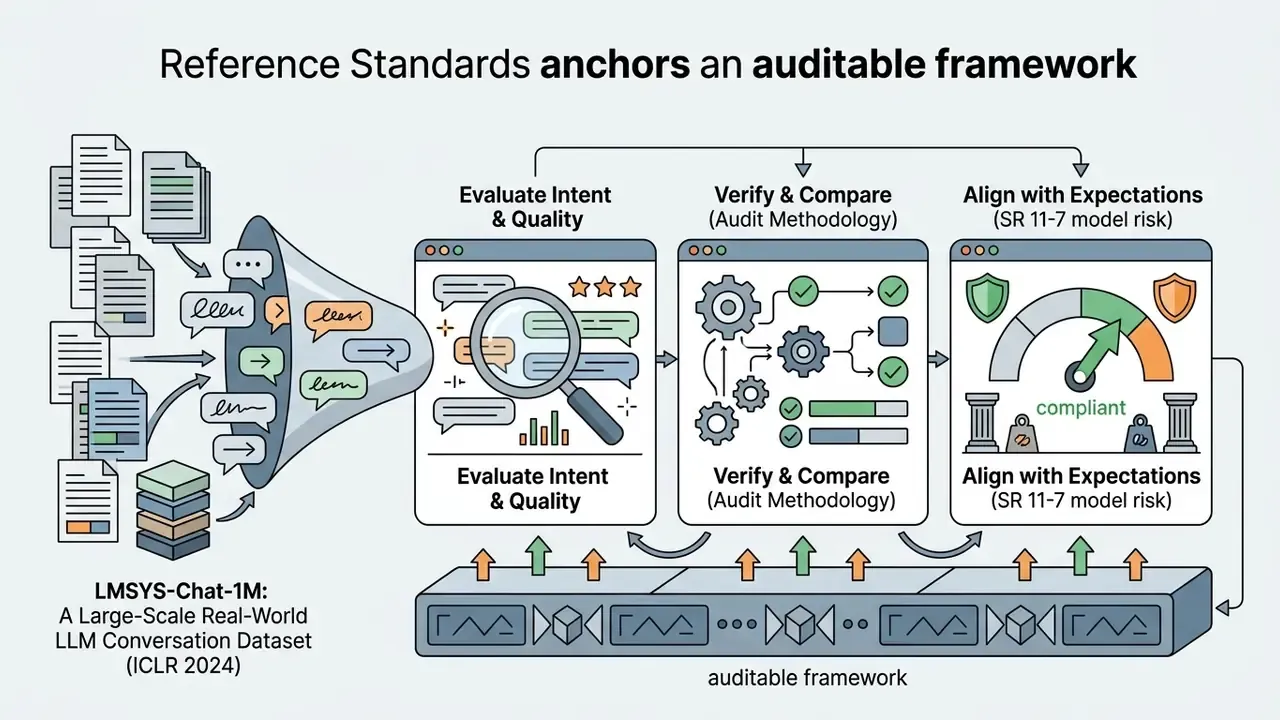
To establish an auditable evaluation framework, model risk leaders should reference established open evaluation protocols and dataset standards:




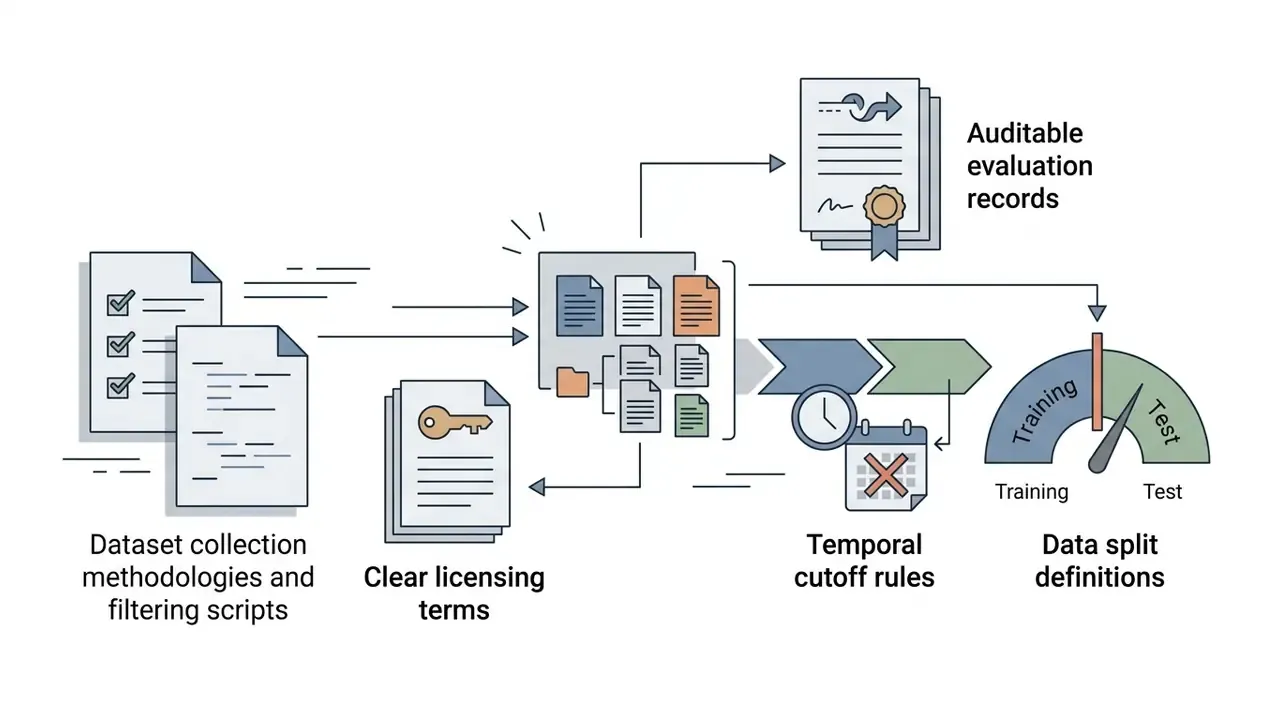
Documentation required for an auditable evaluation
An auditable evaluation package must maintain complete, immutable records across four structural pillars:


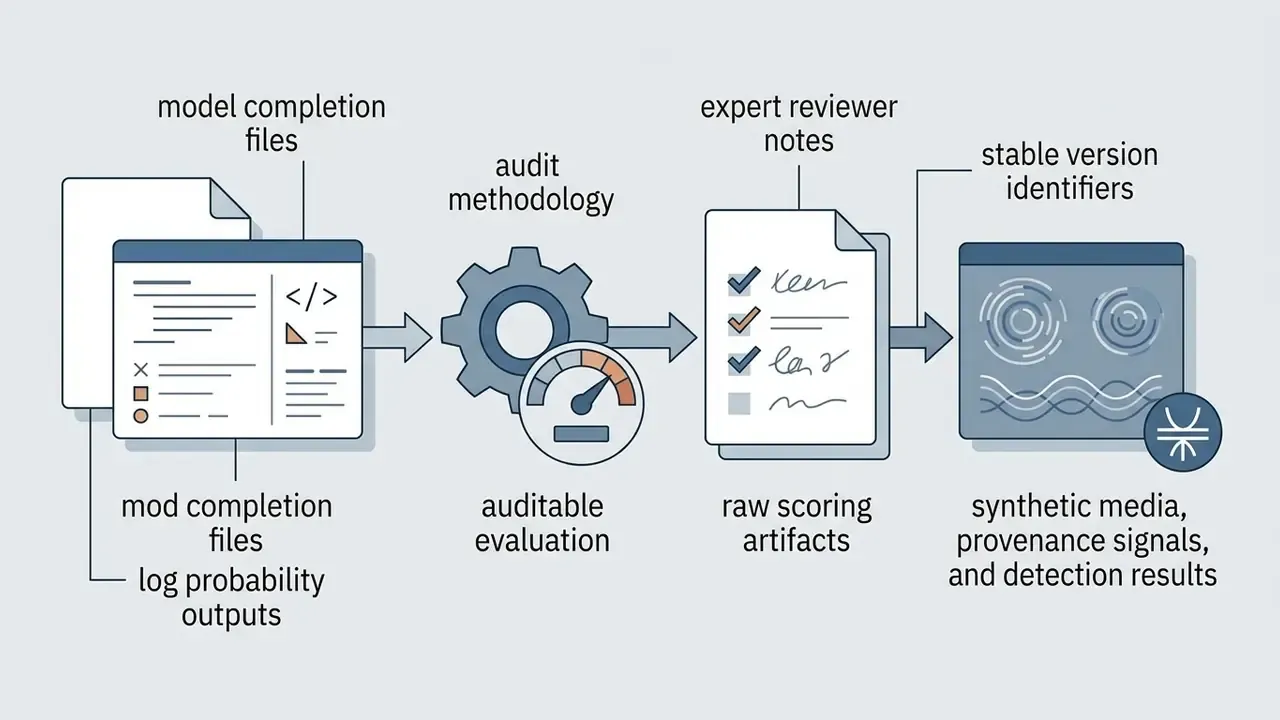
Model card specification
Every validated model should ship with a published model card that an internal auditor or examiner can read without access to the engineering team. Minimum contents:
| Model card field | Requirement |
|---|---|
| Intended use and out-of-scope use | Explicit task boundaries and prohibited applications |
| Task-appropriate metrics | Precision, recall, accuracy or rubric score, chosen per failure mode |
| Confidence intervals | 95% CI reported for every headline metric |
| Lower-bound performance | Worst-performing sub-domain, document type, or segment |
| Evaluation conditions | Dataset composition, prompts, decoding parameters, model version |
| Contamination audit score | Overlap testing method and result, temporal cutoff applied |
| Human oversight regime | Autonomy level, review sampling rate, override statistics |
| Known limitations | Documented conditions under which the model degrades |
| Change log | Re-validation dates, drift events, and what changed |
Model cards are also the transparency artifact recommended by responsible-AI reporting standards, and they should be updated publicly whenever measured performance shifts, not only at initial launch.
Evidence gaps that weaken a benchmark claim
| Evidence gap | Why it invalidates the claim |
|---|---|
| Closed test sets | Evaluation executed on private data with no sample access or documented design rationale |
| Undisclosed prompts | Hidden system prompts or proprietary few-shot tuning make the result unreproducible |
| Missing contamination audits | No analysis of whether test items leaked into pre-training corpora |
| Selective metric reporting | Top accuracy highlighted while toxicity, latency, cost or hallucination rates are withheld |
| Opaque human review | Unspecified reviewer credentials, missing inter-rater reliability metrics, absent override logs |
| No variance reporting | Single-run scores with no seeds, no standard deviation, no confidence intervals |
| No open artifacts | Evaluation code not published under a permissive licence; results cannot be re-run |
Recent academic audits found that roughly 42% of reviewed closed-source AI benchmark papers suffered from documented data leakage, exposing millions of benchmark samples to pre-training datasets and artificially inflating reported model scores.
The same body of work reports approximately 4.7 million benchmark samples across 263 benchmarks exposed in reviewed closed-source papers. Which is why "we scored 92% on a public suite" is a starting hypothesis, not evidence.
How to read AI benchmark results and model comparisons
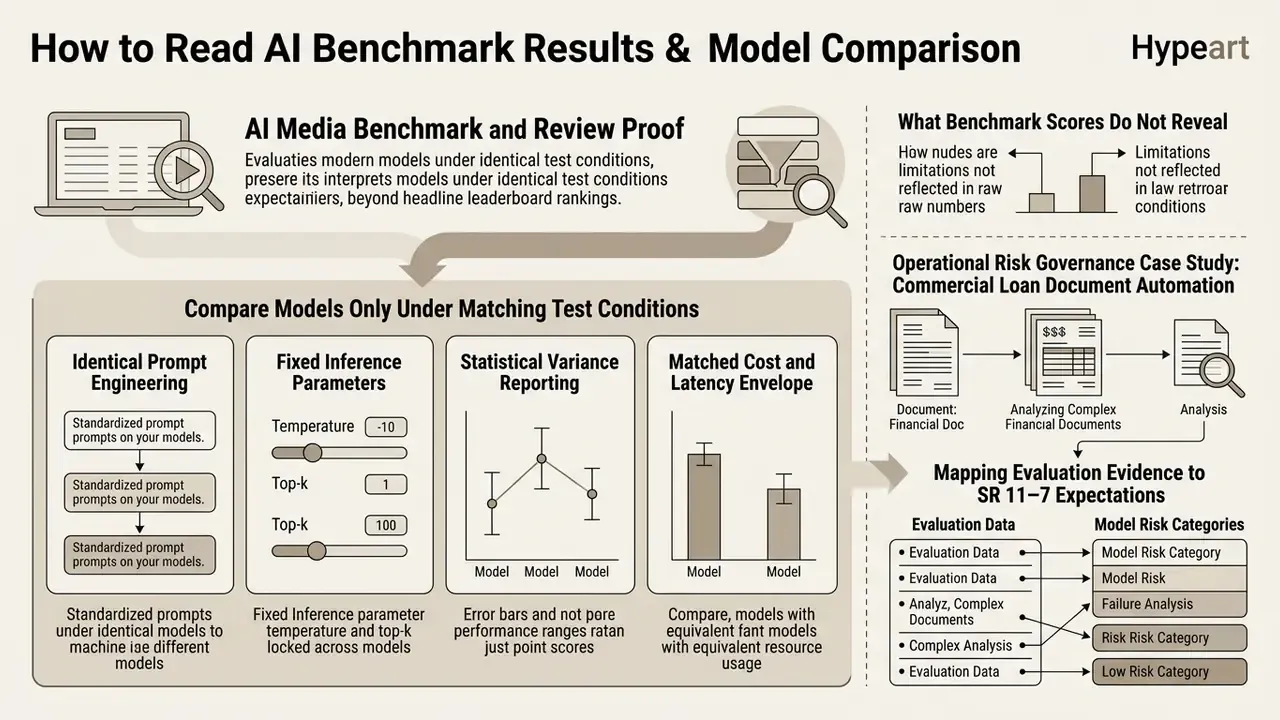
Interpreting ai media benchmarks and review proof results means evaluating models under strictly identical test conditions rather than accepting headline leaderboard rankings at face value. A model that takes top position on a vendor-hosted benchmark often drops noticeably when re-tested under standardized, neutral operational parameters.
Evaluating model performance demands side-by-side analysis across multiple technical variables:
| Evaluation parameter | Public leaderboard claim | Audited enterprise benchmark | Risk assessment impact |
|---|---|---|---|
| Dataset source | Public web-scraped benchmark set | Contamination-filtered private set with temporal cutoff | High: prevents memorization inflation |
| Task realism | Trimmed clips, short single-turn items | Full-length documents, archive video, multi-turn workflows, the conditions under which image-to-text and OCR tools actually run in document intelligence pipelines | High: determines transferability |
| Prompt structure | Unspecified or vendor-optimized prompt | Standardized, frozen prompt template | High: isolates model architecture performance |
| Decoding temperature | Temperature = 0.0 (deterministic) | Temperature = 0.7 with multiple seeds | Medium: exposes variance and output instability |
| Cost and latency | Omitted or quoted at list price | Measured cost per usable output and p95 latency | High: determines production viability and TCO |
| Human expert review | Unverified or automated judge only | Dual-blind expert panel review | Critical: validates real-world semantic safety |
| Raw output access | Summary score table only | Full raw generation logs available | Critical: enables independent auditability |
Compare models only under matching test conditions
Valid cross-model comparison demands complete uniformity across input prompts, system parameters, context window sizes, and execution environments. Research published in Lessons from the Trenches on Reproducible Evaluation of Language Models (arXiv, 2024) states plainly that fair comparison requires the same set of prompts unless there is a documented reason not to, and that exact prompts, prompt-engineering details, hyperparameters and answer-extraction rules should all be reported.
Minor changes in prompt formatting, system instructions, or answer-extraction logic can move a model's relative score materially, in some reported evaluations by double-digit percentage points, because scoring depends on how answers are parsed as much as on what the model generated. Treat any cross-vendor comparison that hides prompt text and extraction logic as directionally unusable, and quantify the effect on your own data before relying on the ranking. (A precise figure for your stack requires internal replication data.)
«Contamination reaches up to 45% on widely used benchmarks and 91.8% on popular multilingual sets; even controlled releases such as Llama 2 show contamination of more than 16% of the MMLU set.»
To execute a fair ai media benchmarks and review proof comparison, model risk teams should enforce four baseline controls:
- Identical prompt engineering. Every candidate model receives the exact same prompt string, system instructions, and few-shot examples.
- Fixed inference parameters. Hyperparameters such as temperature, top-p sampling, and repetition penalties are standardized across test runs.
- Statistical variance reporting. Rather than one score run, execute multiple runs using varied random seeds, reporting mean scores alongside standard deviation error bars and confidence intervals.
- Matched cost and latency envelope. Compare models at the same context length, batch size, and quality guardrail configuration. A model that looks cheaper because it was tested with aggressive frame compression is not comparable to one tested at production fidelity.
What benchmark scores do not reveal
Static benchmark scores frequently obscure operational vulnerabilities that only surface in live production. A high aggregate score does not guarantee global reasoning capability or spatial awareness across media formats.
| Blind spot | What the score hides |
|---|---|
| 1. Local versus global reasoning | Models exploit localized visual cues or superficial text patterns while failing on full-document logic; analyses of widely used multimodal benchmarks found tasks solvable from local cues with spatial bias |
| 2. Intermediate step integrity | High final-answer scores mask broken or hallucinated intermediate reasoning chains and incorrect tool calls |
| 3. Input perturbation fragility | Minor typos, scan artefacts, or layout changes cause catastrophic accuracy drops |
| 4. Systemic drift | Static scores fail to measure output stability over long operational timeframes |
| 5. Economic blindness | Scores conceal the cost of making outputs usable: extra LLM calls for hallucination filtering, retries, human remediation, and guardrail inference are all excluded from the headline metric |
In document processing workflows, studies on PDF analysis (such as GDP.pdf evaluation frameworks) show that models scoring highly on isolated table QA tasks frequently fail when asked multi-page contextual questions in complex corporate documents. Multimedia quality benchmarks based on mean-opinion scores compress rich human judgement into one scalar, hiding semantic failures, user intent, and the reasoning behind quality decisions.
Operational risk governance case study: commercial loan document automation
The following case is illustrative and presented for methodological guidance only. Figures reflect a de-identified engagement pattern and are not a forecast of results for any specific institution.
A major US financial institution evaluated two leading multimodal LLM solutions for automating commercial loan application processing. Vendor A claimed a 92% accuracy score on public benchmark suites. The bank's model risk management team ran its own private evaluation pipeline instead, using 150 anonymized historical loan files, all originated after both candidate models' published training cutoffs.
The private evaluation revealed that Vendor A's performance dropped to 71% on complex multi-page financial statements, suffering layout confusion and hallucinating credit terms. Its lower-bound accuracy on the scanned-statement segment fell to 58% at the 95% confidence interval, which disqualified it from any automated path. Vendor B, slightly weaker on public leaderboards at 88%, held 86% accuracy on the bank's private test suite with zero high-severity hallucinations and a lower bound of 79% on its weakest segment.
Economics separated the two candidates further. Vendor A required an average of 2.4 generation attempts plus a secondary verification call per usable summary; Vendor B needed 1.3. Once retries, guardrail inference and human remediation time were included, the institution recorded a 34% lower total cost of governance per usable output at a fixed p95 latency below 800 ms, even though Vendor B's per-token list price was marginally higher.
The institution deployed Vendor B under a human-on-the-loop oversight framework, automating 60% of routine document reviews while keeping complete auditability for regulatory compliance. Rubric scoring with a −10 automatic-failure trigger for invented credit terms stayed in place as a permanent production guardrail, and the segment with the weakest lower bound remained on full human review.
Mapping evaluation evidence to SR 11-7 expectations
| SR 11-7 / OCC 2011-12 pillar | Evaluation artifact that satisfies it | Common examiner finding when missing |
|---|---|---|
| Conceptual soundness | Evaluation charter, task-relevance rationale, dataset card, prompt registry, benchmark-selection justification | Reliance on vendor leaderboard scores with no documented link to intended use |
| Ongoing monitoring | Telemetry, drift alerts, periodic re-benchmarking cadence, override logs, kill-switch procedures | Point-in-time procurement testing only |
| Outcomes analysis | Back-testing on private historical records, lower-bound performance by segment, error taxonomy | Aggregate accuracy reported without segment-level breakdown |
| Effective challenge | Independent validation team, expert dual review, reproducible code and raw logs | Validation performed by the implementation team |
| Model inventory and documentation | Model card, version identifiers, change log, known limitations | Undocumented prompt or model-version changes in production |
Benchmark limitations: contamination, saturation and real-world gaps
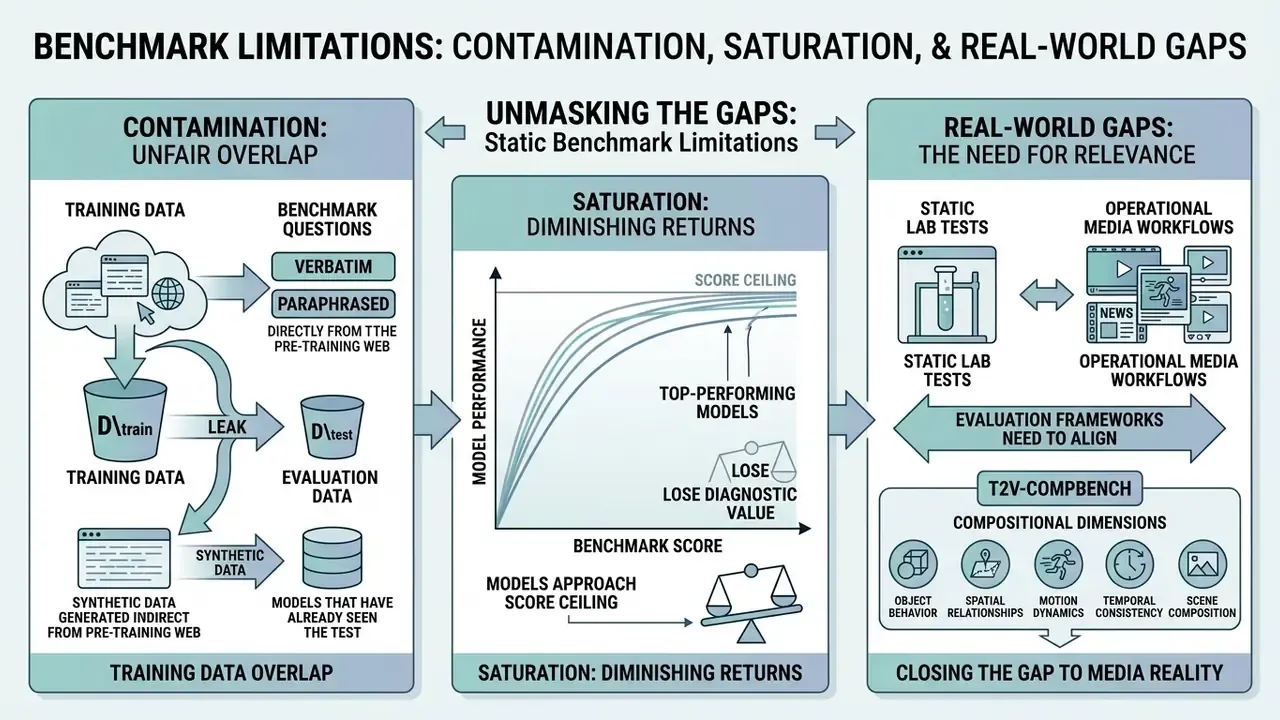
Understanding benchmark limitations is how you prevent model risk failures rather than document them afterwards. The pace of model development has exposed three structural weaknesses in conventional evaluation suites: data contamination, benchmark saturation, and the gap between lab testing and production reality.
| Data contamination | Saturation | Real-world gap |
|---|---|---|
| Test data leaks into training corpora, inflating scores by roughly 1% to 45.8% | Top models cluster near the score ceiling within about 12 months, losing discriminative power; public benchmarks saturate faster than private held-out sets | Static tests fail to reflect complex, multi-step, human-in-the-loop workflows and omit cost, latency and throughput entirely |
Why static benchmarks can lose diagnostic value
Static benchmarks lose diagnostic value when top-performing models approach the score ceiling and when test items leak into public training corpora. Once a benchmark saturates, differences between leading models compress into narrow margins, say 94.1% against 94.5%, that represent statistical noise rather than meaningful architectural superiority.
«A saturation index derived from leaderboard data quantifies the loss of discriminative power as models converge toward similar results.»
Training data contamination, where benchmark questions appear verbatim or paraphrased in pre-training web scrapes, turns evaluation runs into tests of memorization rather than reasoning. Research on benchmark leakage indicates that verbatim overlap with Common Crawl data inflates measured model performance by anywhere from 1% to 45.8%.
Contamination also enters indirectly: through synthetic data generated by a model that had already seen the benchmark, and through overfitting to the evaluation set during model or prompt selection. As a result, static leaderboards quickly lose their ability to predict how a model behaves on novel, unseen enterprise data, and a private held-out set with a temporal cutoff becomes the only reliable arbiter.
Closing the gap between benchmark and media reality
To close the gap between static lab tests and operational media workflows, evaluation frameworks need dynamic, multi-modal testing environments. Enterprise media operations rarely consist of isolated single-turn question and answer pairs. They involve continuous document ingestion, multi-speaker audio alignment, long-duration video processing, strict cost controls, and the composite pipelines built around AI image generators and downstream review steps.
| Academic lab benchmarks | Production media reality |
|---|---|
| Short text clips (under 500 words) | Multi-page long-context documents |
| Single-frame visual inputs | High-resolution, multi-frame, long-duration video |
| Trimmed 10 to 30 second clips | Short-form ads and long-form episodes, sports, news |
| Object- and action-level questions | Higher-order semantics: meaningful moments, promo selection, narrative summaries, genre, intent |
| Unlimited compute per test item | Strict latency, throughput and operational budgets |
| Isolated single-turn tasks | Complex, multi-agent, tool-calling workflows |
Frameworks such as T2V-CompBench evaluate video generation across seven compositional dimensions using MLLM-based, detection-based and tracking-based metrics, while EvalCrafter separates video quality, text-video alignment, motion quality and temporal consistency. Tools measuring the Cost per Usable Output Benchmark help risk executives calculate the true operational cost of filtering out low-quality or hallucinated generations, and text-to-video AI tools deserve the same dual quality-and-economics lens. For teams that need per-request economics before committing to a pipeline, published implementation economics such as the Google Veo API cost and limits guide show how quickly generation costs scale with duration and resolution. Adopting domain-specific, dynamic evaluation sets keeps model selection tied to real-world operational economics rather than leaderboard prestige.
Building an AI benchmarking strategy that evolves with the model
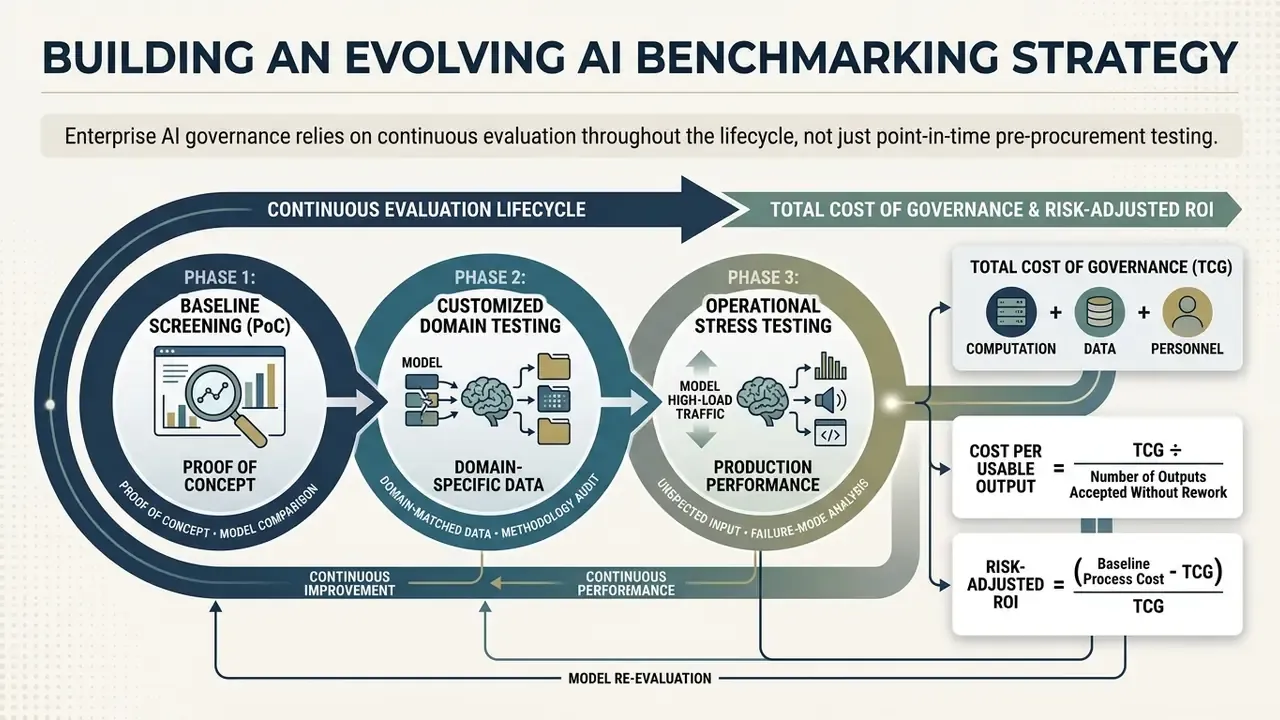
Enterprise AI governance depends on a continuous evaluation lifecycle, not point-in-time pre-procurement testing. Standard governance frameworks, including ISO/IEC 42001:2023 and the EU AI Act (Articles 9 and 17), mandate continuous model monitoring, post-market surveillance, and iterative performance re-validation across the AI system's lifecycle. SR 11-7 imposes the same expectation on US banks through its ongoing-monitoring pillar.
| Stage | Focus | Primary evaluation mode |
|---|---|---|
| Stage 1: PoC screening | Filter unfit architectures | Public benchmark filtering |
| Stage 2: Domain validation | Prove fit to proprietary workflows | Custom enterprise dataset testing |
| Stage 3: Production monitoring | Detect degradation in live use | Telemetry and error log analysis |
| Stage 4: Failure analysis | Explain and remediate root causes | Continuous drift detection and ML-FMECA |
From proof of concept to production performance
Moving an AI system from initial proof of concept into controlled production requires escalating evaluation rigour across three phases:
- Phase 1, baseline screening (PoC). Use public benchmarks such as HELM, MMEB-V2 and MVBench to filter out architectures that fail fundamental accuracy, reasoning, or safety thresholds. Expect 20 to 50 domain-relevant examples added here purely to surface obvious failure patterns.
- Phase 2, customized domain testing. Construct private internal benchmarks from sanitized historical corporate data to evaluate performance on proprietary workflows. Typical scale is 200 to 1,000 curated examples reflecting real user behaviour and corner cases, scored with rubric-based or judge-assisted grading plus periodic human spot checks. Never reuse examples the team already used to tune prompts; seen data invalidates the benchmark.
- Phase 3, operational stress testing. Evaluate behaviour under simulated production loads, measuring latency, memory overhead, hallucination rates, cost per usable output, and graceful degradation limits.
Continuous evaluation and failure-mode analysis
Deploying generative AI into production introduces output drift, prompt sensitivity decay, and gradual system degradation. Model governance frameworks should implement continuous telemetry capture combined with Failure Mode, Effects, and Criticality Analysis (FMECA) adapted for machine learning systems.
| Failure mode | Root cause | Severity | Mitigation strategy |
|---|---|---|---|
| Concept drift | Shifting underlying market conditions | High | Automated re-indexing and trigger alerts |
| Silent tool degradation | Unannounced third-party API payload changes | Critical | API contract tests and schema validation |
| Cascading error propagation | Hallucinated output feeds downstream agent | High | Output constraint guardrails and checks |
| Prompt sensitivity decay | Provider-side model update under a stable version alias | High | Canary prompts run on a fixed cadence with variance alarms |
| Cost regression | Rising retry rate to reach usable quality | Medium | Cost-per-usable-output monitoring with budget thresholds |
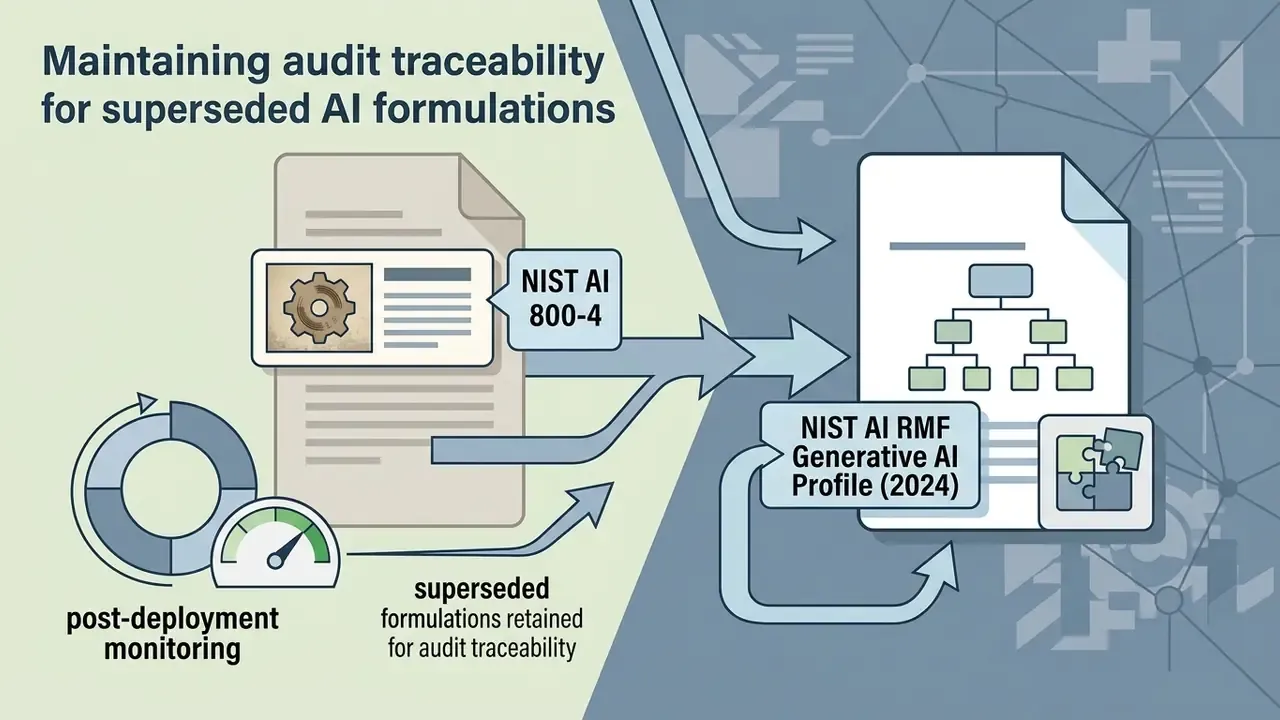
For post-deployment monitoring, NIST guidance describes continuous collection of operational signals and evaluation against predefined risk thresholds, with risk-measurement approaches reassessed and adversarial testing repeated at regular cadences (NIST AI Risk Management Framework: Generative AI Profile, 2024; https://nvlpubs.nist.gov/nistpubs/ai/NIST.AI.600-1.pdf). Enterprise frameworks should therefore track real-time operational signals, maintain automated kill-switch capabilities, and set pre-defined risk thresholds that trigger human intervention when drift exceeds acceptable boundaries. For agentic deployments, add trajectory-level controls: per-step tool-call validation, spend and action caps per session, and mandatory human approval before any irreversible financial action.
Total cost of governance and risk-adjusted ROI
A model that passes accuracy gates can still destroy value if the controls needed to make it safe cost more than the work it replaces. Quantify the full control burden before approval:
Total Cost of Governance (TCG) = inference and API spend (including retries) + guardrail and verification inference + human review and remediation labour + monitoring, logging and storage + validation and audit effort + incident and remediation reserve
Cost per usable output = TCG ÷ number of outputs accepted without rework
Risk-adjusted ROI = (baseline process cost − TCG) ÷ TCG, with the baseline measured on the same task, same volume, and same quality acceptance criteria as the automated path.
Two disciplines keep this calculation honest. First, count retries and verification calls as production cost, not experimental overhead; a pipeline needing 2.4 attempts per usable summary burns roughly twice the tokens of one needing 1.2. Second, hold latency fixed when comparing options. A cheaper configuration achieved by shrinking context or compressing frames is a different product, not a better price.
Proof navigation checklist for selecting an AI model
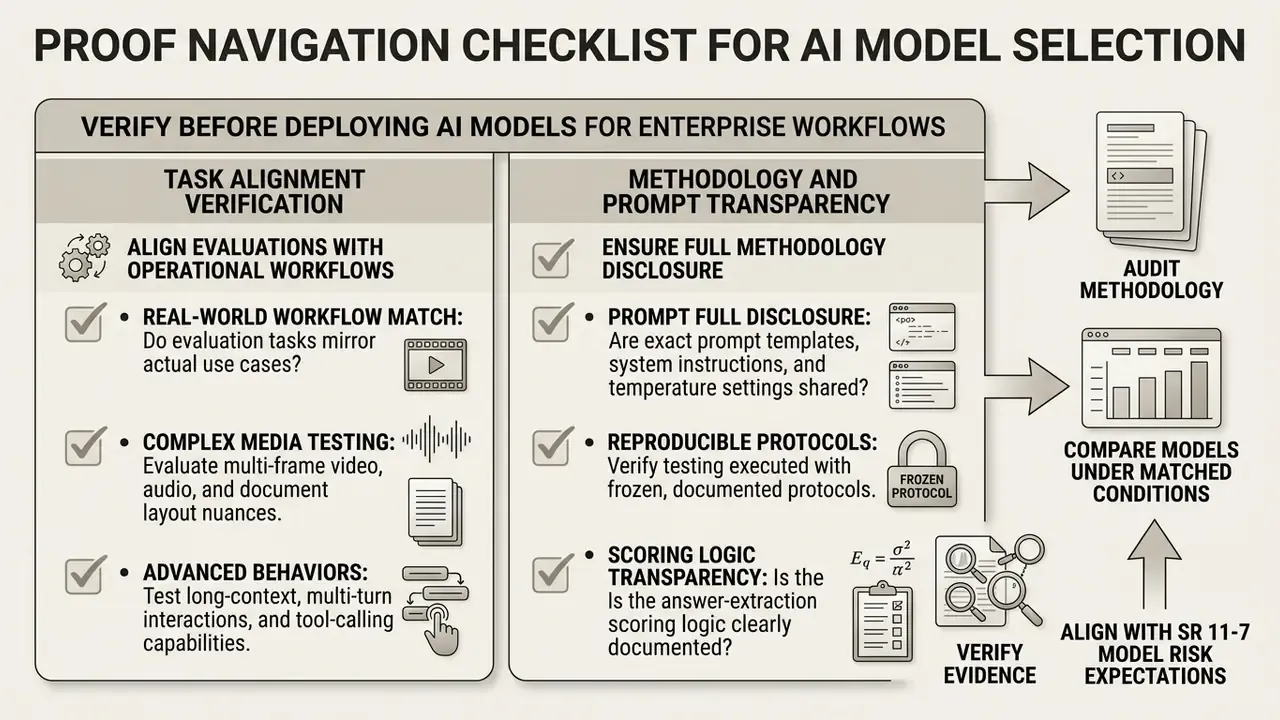
Before selecting and deploying an AI model for enterprise media workflows, governance leaders should run a verification checklist confirming that benchmark results, review proofs, and evidence chains satisfy institutional risk appetite.
1. Task alignment verification
- Do evaluation tasks match real-world operational workflows?
- Are multi-frame video, audio, or document layout nuances tested?
- Are long-context, multi-turn and tool-calling behaviours represented?
2. Methodology and prompt transparency
- Are exact prompt templates, system instructions, and temperature settings fully disclosed?
- Has testing been executed using frozen, reproducible protocols?
- Is the answer-extraction and scoring logic documented?
3. Contamination and leakage control
- Has the evaluation set been audited for training data contamination?
- Do evaluation items post-date the model's training-data cutoff, with a temporal cutoff applied?
- Were dynamic perturbations or private held-out sources used?
4. Expert human review audit
- Were qualitative review outputs validated by qualified domain experts?
- Are inter-rater agreement statistics and override logs documented?
- Is the human baseline (two independent reviewers to consensus) explicitly stated?
5. Performance floor and statistical rigour
- Are confidence intervals reported alongside every headline metric?
- Is the lower-bound performance known for every material sub-domain?
- Does the autonomy level requested match the evidence tier achieved?
6. Economics and deployment feasibility
- Is cost per usable output measured, including retries and guardrail calls?
- Are p50 and p95 latency and throughput per dollar recorded at production fidelity?
- Has total cost of governance been compared against the current process baseline?
7. Reproducibility and open artifacts
- Is the evaluation codebase available under a permissive open licence (MIT / Apache 2.0)?
- Is any shareable evaluation dataset released under CC-BY or an equivalent licence permitting verification and commercial reuse?
- Are seeds, environment details, hardware metadata and replication scripts provided?
8. Documentation and accountability
- Is a published model card available with limitations, confidence intervals and a change log?
- Are raw logs retained with stable model, prompt and judge version identifiers?
- Do artifacts map cleanly to SR 11-7 conceptual soundness, ongoing monitoring and outcomes analysis?
9. Independent internal validation
- Has the model been re-tested on a private, internal enterprise dataset?
- Was validation performed by a team independent of implementation (effective challenge)?
- Do variance metrics and error margins satisfy risk tolerance limits?
Next steps for governance leaders
- Week 1, inventory and classify.List every AI use case in flight, tag each by impact of error and requested autonomy level, and mark which ones currently rest on vendor benchmark claims alone.
- Weeks 2 to 3, build the private evaluation set.Extract 100 to 150 real, de-identified records per task family, all post-dating candidate models' training cutoffs, and have two qualified reviewers resolve each to consensus.
- Week 4, freeze the protocol.Publish the prompt registry, decoding parameters, rubric scale (−10 to +10 with automatic-failure triggers), and the metric set including cost per usable output and p95 latency.
- Weeks 5 to 6, run matched comparisons.Execute multi-seed runs for each candidate, compute means, confidence intervals and lower bounds by segment, and record contamination-audit results.
- Week 7, decide the autonomy tier.Approve automation only where the lower bound clears the human baseline for that segment; route weaker segments to human-in-the-loop or exclude them.
- Week 8, package for the risk committee.Deliver the model card, the SR 11-7 mapping table, the total-cost-of-governance calculation, and the monitoring plan with drift thresholds and kill-switch criteria.
- Ongoing, hand off to internal audit and re-validate.Provide raw logs, code and reviewer notes to internal audit; re-benchmark at least semi-annually and immediately upon any model, prompt, tool or data-distribution change.
FAQ about AI media benchmarks and review proof
How often should AI evaluations be updated?
Continuously, with formal re-benchmarking on a cadence aligned to model release cycles and operational shifts. Guidance from NIST and UK AI management standards recommends reviewing AI system records at least semi-annually; the UK's AI Management Essentials self-assessment explicitly offers "twice a year or more" as the strongest option. Immediate re-evaluation should trigger whenever underlying model architectures, prompt templates, tool integrations, or input data distributions change. In high-risk financial processing workflows, automated monitoring scripts should track operational output metrics daily or continuously.
«Lifelong Benchmarks reduce evaluation cost by roughly 1,000 times, from about 180 GPU-days to 5 GPU-hours, with minimal approximation error via a Sort & Search algorithm.» Lifelong Benchmarks research (2024)
That efficiency gain is what makes continuous re-evaluation economically realistic rather than aspirational: teams can re-score an expanding pool of items without re-running the full suite each cycle. After each refresh, decision-makers should also revisit tool shortlists, including current AI video generators, because relative rankings shift with every model generation.
Can an AI system evaluate its own output?
An AI system should never serve as the sole evaluator of its own output, or of peer model outputs, in enterprise production settings. "LLM-as-a-Judge" frameworks offer scalable preliminary feedback during development, yes. But academic evaluations document self-enhancement bias (favouring their own generated outputs), position bias (favouring the first presented option), and verbosity bias (scoring longer completions higher regardless of factual accuracy). One 2026 systematic evaluation reported judge rankings shifting by up to 14 positions across benchmarks, with self-preference bias above 50% in some rubric-based cases, even where criteria were programmatically verifiable.
«Benchmarks that rely on LLM judges suffer from bias when scoring difficult questions, which motivates using tasks with objectively verifiable answers.» LiveBench: A Challenging, Contamination-Free LLM Benchmark (2024). https://arxiv.org/abs/2406.19314
Enterprise risk management therefore requires validating automated judge outputs against calibrated expert human annotations, reporting judge-to-human agreement, and re-calibrating the judge whenever the underlying judge model version changes.
When is a custom benchmark better than a public benchmark?
A custom corporate benchmark wins whenever public benchmarks fail to reflect your data distributions, proprietary domain terminology, complex document layouts, or legal compliance constraints. Studies comparing enterprise tabular and document processing show that models topping public suites frequently drop sharply on noisy, real-world corporate records. The reverse also happens, with models that look mediocre publicly performing well on enterprise data.
«URS shows how user-centred benchmarks are built from real interaction logs, capturing authentic intents and language patterns across 23 countries.» User Reported Scenarios (URS) benchmark (2024)
Private, internal evaluation suites eliminate contamination risk and give model risk committees direct evidence of operational readiness. Keep public benchmarks for stage-1 screening and vendor-neutral capability filtering; rely on custom sets for every deployment decision.
How do benchmark artifacts satisfy SR 11-7 examiners?
Examiners look for a traceable chain, not a score. Conceptual soundness is evidenced by the documented rationale linking chosen tasks and datasets to intended use. Ongoing monitoring is evidenced by telemetry, drift thresholds and re-benchmarking cadence. Outcomes analysis is evidenced by back-testing on private historical records with segment-level lower bounds. Effective challenge requires validation by a team independent of the builders, with access to raw logs and reproducible code. Absent those artifacts, a vendor benchmark result is treated as an unverified assertion.
What metrics should appear in a board-level AI report?
Four families, always paired: (1) task quality with confidence intervals and the worst-segment lower bound; (2) safety and compliance incident counts, including rubric automatic-failure triggers; (3) economics, meaning cost per usable output, total cost of governance, and risk-adjusted ROI against the process baseline; (4) operational stability, meaning p95 latency, throughput, drift alerts raised, and human override rate. Reporting quality without economics understates the risk of value destruction. Reporting economics without lower-bound quality understates the risk of harm.
How should agentic AI be evaluated differently?
Agentic systems must be scored on trajectories, not final answers. Add tool-call schema conformity, retrieval grounding rate, unnecessary-action rate, recovery behaviour after a failed tool call, and abstention correctness when required evidence is missing. Because errors cascade, the acceptable per-step error rate is far lower than the acceptable end-task error rate: at ten sequential steps, a 2% per-step failure rate produces roughly an 18% chance of at least one failure per session. Session-level spend caps, irreversible-action approval gates, and full trajectory logging are mandatory controls, not optional refinements.
Appendix A: superseded formulations retained for audit traceability
For transparency, earlier phrasings revised in this edition are preserved verbatim below alongside the reason for revision.
Disclaimer. This article provides general information on AI evaluation methodology and model risk governance practice. It is not legal, regulatory, financial, audit or investment advice, and it does not create any advisory relationship. Regulatory expectations, including those under SR 11-7 / OCC Bulletin 2011-12, the EU AI Act, and applicable state and federal consumer-protection rules, depend on institution type, use case, and supervisory context. Consult qualified legal, compliance and model risk professionals before relying on any framework, threshold, formula, or case example described here. Case studies are illustrative and de-identified; figures are not projections. Marcus Hale, author. The methodology described is vendor-independent and is not endorsed by any model provider.
Last reviewed and updated: 2026 edition. Maintained by the AI Governance & Model Risk editorial desk.