Executive Summary
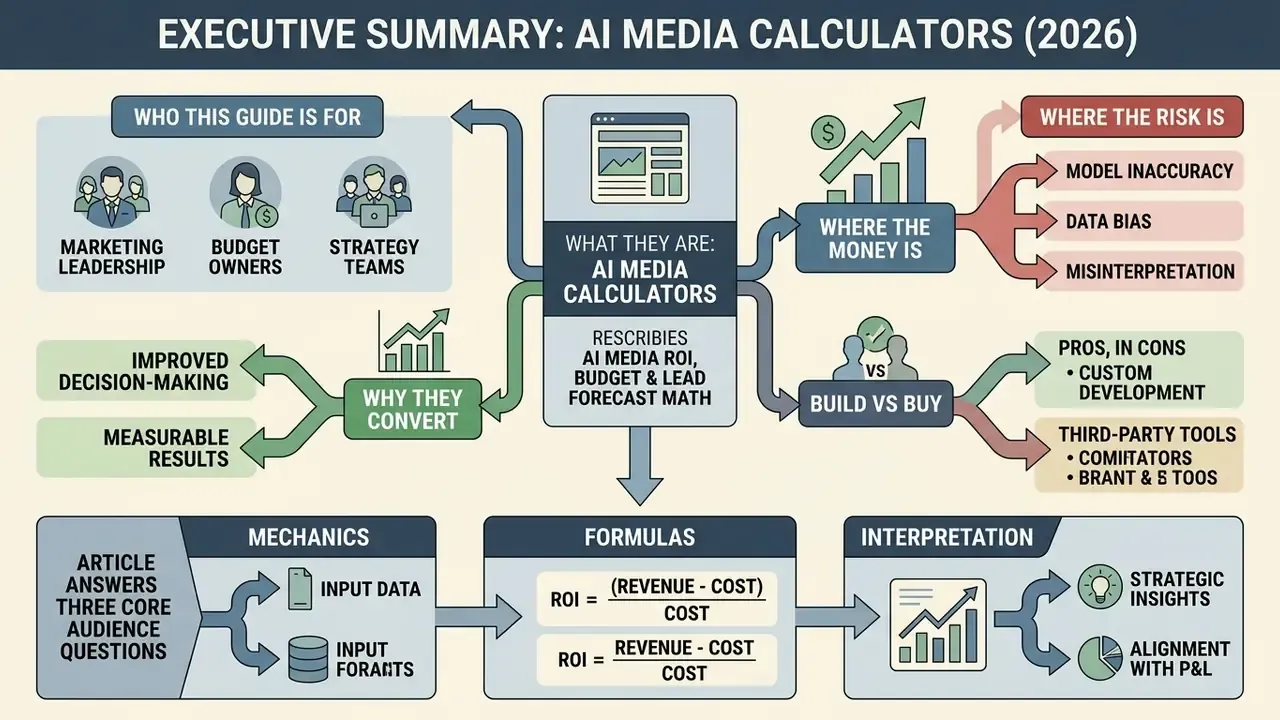
- What they are. AI media calculators convert spend, labor hours, conversion rates, margin, and LTV into ROI, fully loaded CPA, payback period, and qualified-lead forecasts. Two layers do the work: a deterministic accounting layer and a probabilistic machine-learning layer.
- Why they convert. Interactive calculators beat static forms because of three behavioral mechanics: immediate gratification, the investment (sunk-effort) effect, and self-qualification. Interactive content is widely reported to generate roughly twice the conversions of static assets, with calculator-driven lead capture improving form conversion by 40-60%.
- Where the money is. Enterprise-grade implementations apply Marketing Mix Modeling (MMM) logic to tie channel spend to P&L line items and isolate incremental revenue, not merely attributed conversions.
- Where the risk is. Outputs are statistically informed estimates, not guarantees. Institutional deployments require fully loaded cost inputs (including control and compliance costs), independent model validation in the spirit of SR 11-7 and OCC model-risk guidance, drift monitoring per the NIST AI Risk Management Framework, registration in the corporate AI systems inventory, and human-in-the-loop sign-off for any final budget approval.
- Build vs Buy. In-house builds win on control, model transparency, and GRC integration. Commercial platforms win on time-to-value and maintenance. A comparison matrix appears below.
Who this guide is written for
Three roles usually arrive on this page with different questions. A CFO or Head of Finance Transformation wants to know whether the payback number will survive audit. A CRO or demand-generation lead wants a calculator that qualifies traffic without burning trust. A Head of Model Risk wants to know who owns the endpoint, who validated the formula, and where the evidence lives.
The article answers all three in sequence: mechanics first, then formulas, then interpretation, then integration, then controls. If you only have five minutes, read the Executive Summary above, the institutional ROI formula, and the validation checklist near the end. Those three blocks carry most of the decision weight.
What AI Media Calculators Are and the Jobs They Solve
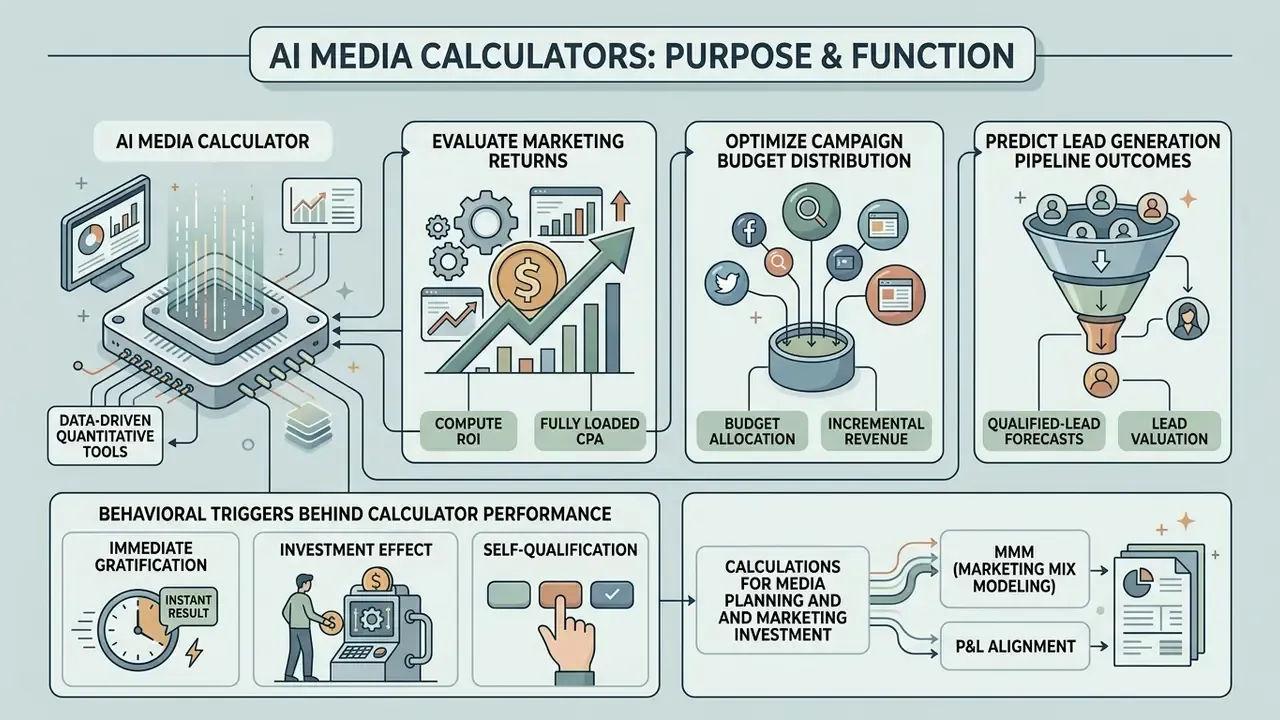
AI media calculators are data-driven quantitative tools built to evaluate marketing returns, optimize campaign budget distribution, and predict lead generation pipeline outcomes in real time. Organizations deploy them to replace static spreadsheet models with dynamic forecasting systems capable of processing streaming campaign inputs and non-linear performance curves. It is the same procurement logic teams apply when they benchmark creative tooling such as AI video generators against production cost baselines.
Static financial templates apply fixed formulas to historical inputs and require manual rebuilds whenever channel dynamics shift. Modern ai media calculators use machine learning architectures, including Q-learning, gradient-boosting, and large language models (LLMs), to evaluate alternative budget scenarios, quantify operational risk, and estimate expected monetary value dynamically.
In practice, these calculators give executive leadership a controlled environment for simulating marketing investment before capital leaves the account. They process inputs across paid channels, labor allocations, and sales velocity metrics, then convert messy data into transparent risk-adjusted projections.
Behavioral Triggers Behind Calculator Performance
Interactive calculators outperform gated PDFs and contact forms, and not because of prettier graphics. The reason is measurable behavioral mechanics. Static forms ask visitors to extend trust before receiving value; calculators invert that sequence and deliver personalized utility first. Interactive experiences are consistently reported to generate roughly double the conversions of passive static content, and calculator-based capture flows are commonly cited as lifting form conversion rates by 40-60% versus plain lead forms.
Three mechanisms drive that lift:
- Immediate gratification.The user receives a personalized number within seconds. No waiting for a sales representative, no scheduled call. The exchange feels fair rather than transactional.
- Investment effect (sunk effort).After entering five to seven parameters, budget, hours, rates, conversion rate, deal size, the user has invested cognitive effort. The probability of submitting a business email to unlock the full PDF breakdown rises sharply, because abandoning the flow now feels like throwing away work already done.
- Self-qualification.The calculation exposes the prospect's own economics in numbers before any sales contact. Prospects who see a negative payback disqualify themselves. Prospects who see a nine-month payback arrive at the first call already carrying a business case they built themselves.
Reported lead-conversion rates for calculator experiences typically range from 20% to 60%, depending almost entirely on the gating strategy: how much value is exposed free versus reserved behind the email request. Worth saying plainly, those ranges come from vendor and agency reporting rather than audited studies, so treat them as directional.
Calculations for Media Planning and Marketing Investment
Calculators designed for media planning compute optimal budget allocations across fragmented advertising channels to maximize campaign returns under total spending caps. These systems evaluate marginal reach, channel decay curves, and cost-per-click dynamics to prevent over-allocation into saturated placements.
Academic optimization research shows that Q-learning algorithms combined with swarm intelligence metaheuristics can dynamically optimize multi-channel advertising budgets against explicit ROI targets.
«Q-learning combined with a modified bee-colony (ML-ABC) metaheuristic allocates budget across channels by discretizing spend into states with expected Q-values.»
By discretizing budget levels into discrete decision states, the software computes expected cumulative returns (Q-values) for each prospective allocation.
This multi-channel calculation lets finance and marketing operators move from flat channel cuts to profit-aware media allocation. The output establishes clear spending floors and caps, protecting institutional capital while preserving reach across competitive acquisition channels.
MMM, incremental revenue, and P&L alignment. Enterprise AI media calculators go a step past marginal ROI by applying Marketing Mix Modeling (MMM) algorithms that correlate channel spend with profit-and-loss line items. Instead of reporting base attributed conversions, the calculation isolates incremental revenue, the top-line growth that would not have occurred without that specific media injection. Practically, the calculator answers three P&L questions in a single pass:
- Which channels drive revenue that is genuinely additive rather than harvested demand?
- What is the contribution margin of each incremental dollar after COGS, agency fees, and internal labor?
- Which budgets can be defended during annual planning because they map to a measurable bottom-line effect?
That P&L alignment is what allows media planners to protect budgets and argue for more investment with finance leadership, instead of defending channels on last-click counts. It also explains why margin-based ROI and ROAS diverge: ROAS ignores COGS and gross margin, while profit-based ROI does not.
Calculators for Lead Generation and Lead Valuation
Lead generation calculators convert campaign volume, deal size expectations, and sales cycle length into qualified pipeline estimates and cost-per-lead (CPL) benchmarks. Rather than treating all inbound traffic as one undifferentiated pool, these tools apply predictive lead scoring models that classify prospects by conversion propensity.
Advanced framework implementations use reinforcement learning from performance feedback to evaluate sales lead routing and prioritization.
«SalesLoop was trained on 16.5 million leads over 160 days; the model improved NDCG@K by 7.9% and P@K precision by 15.8% over the strongest static baseline.»
By weighting conversion outcomes against ranking position and interaction velocity, lead value calculators output continuous scores that push high-value prospects to the front of the queue. The +15.8% precision gain quoted above is exactly the mechanism behind that prioritization.
These models let organizations quantify expected revenue per lead before anyone starts manual outreach. Commercial teams then spend less time on cold prospects and more on sales-ready opportunities. A modest shift in minutes-per-lead, multiplied across a 12-person SDR floor, is usually where the first credible savings number appears.
Types of AI Calculators for Marketing, Pricing, and Lead Generation
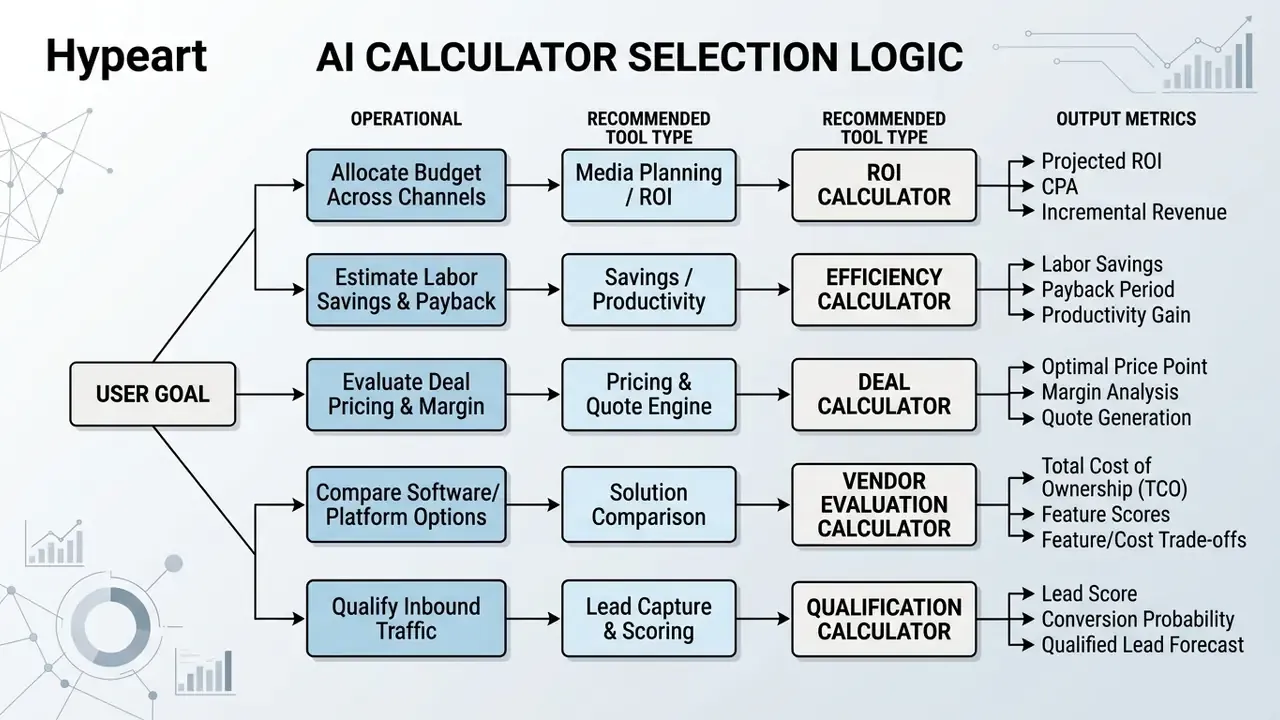
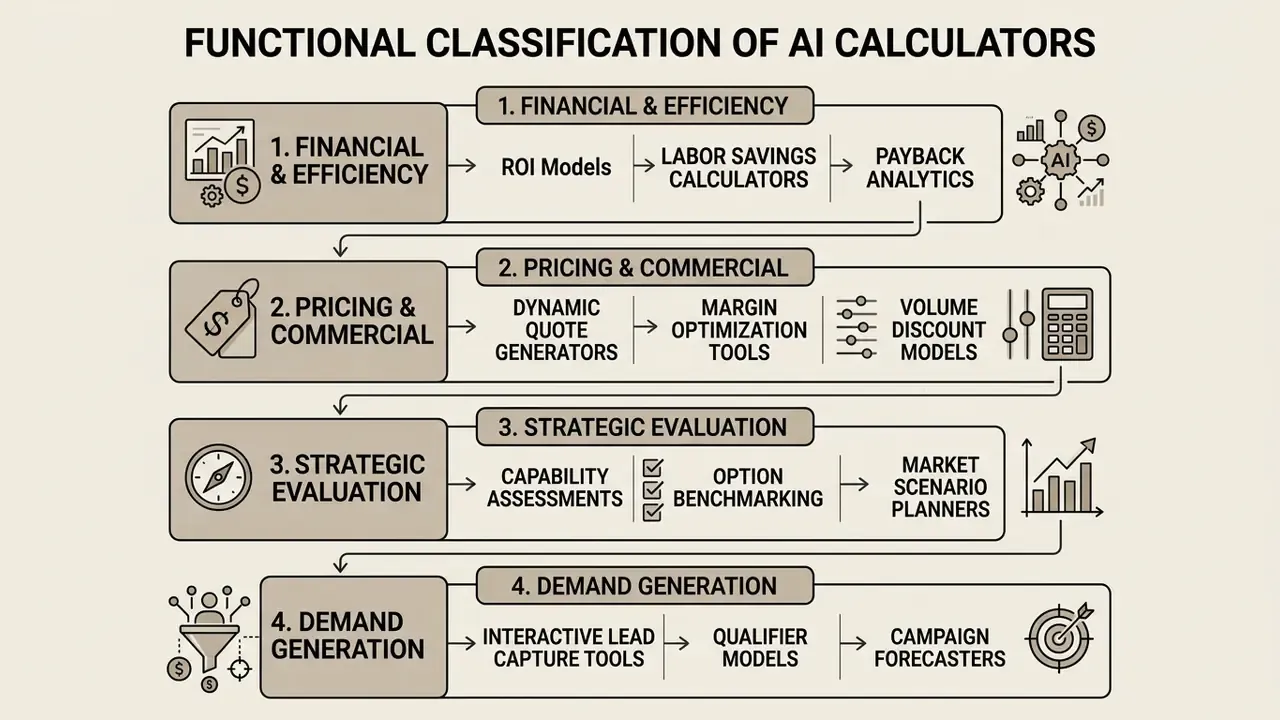
Specialized calculator formats address distinct operational decisions across marketing, pricing, and lead capture workflows. Picking the right architecture keeps outputs aligned with the decisions executive stakeholders actually make. Understanding the taxonomy before diving into formulas prevents a common failure: building a mathematically elegant model that answers a question nobody asked.
Organizations deploy distinct calculator categories depending on whether the goal is financial evaluation, vendor comparison, dynamic pricing, or inbound prospect capture. The same selection discipline applies when marketing teams compare creative production stacks, for example when shortlisting AI video generators by output quality, credit consumption, and licensing terms.
Four Calculator Types: Inputs and Outputs
| Calculator type | Core inputs | Primary outputs | Best-fit buying stage |
|---|---|---|---|
| 1. ROI & efficiency | Labor hours per week, hourly fully loaded rate, headcount, tooling fees, current process cost | Hours saved per month, annual savings, projected ROI %, payback period in months | Business-case building, procurement approval |
| 2. Dynamic pricing & quote engines | Volume tiers, feature modules, contract length, monthly ad spend, service scope | Custom ARR/quote figure, discount envelope, margin-protection score | Mid-funnel, pre-negotiation self-selection |
| 3. Assessment & audit tools | Current tech stack, workflow maturity answers, governance controls in place, security practices | Maturity score 0-100, gap analysis by domain, prioritized remediation list | Early education, problem-awareness stage |
| 4. Comparison calculators | Vendor A cost, Vendor B cost, migration effort, licensing terms, expected usage growth | 3-year total cost of ownership (TCO) delta, break-even month, side-by-side scorecard | Late-stage vendor shortlisting |
Worked examples. A B2B software vendor builds an ROI calculator asking for current hours spent per week, hourly employee cost, and team size, then outputs annual savings, handing sales a number the prospect has already accepted. A performance agency builds a pricing calculator on monthly ad spend, campaign count, and required services, filtering out prospects below the minimum viable retainer before a human ever gets involved. A cybersecurity firm builds a security-posture assessment that scores current practices and recommends improvements, positioning its own services almost as a byproduct. A lender builds a loan comparison calculator showing total cost, monthly payment, and lifetime interest across competing offers, and reads as an advisor rather than a vendor.
ROI, Savings, and Pricing Calculators
ROI and savings calculators evaluate capital efficiency, operational cost reductions, and payback horizons tied to process automation or marketing programs. They quantify the direct financial benefit of moving manual operations into automated software workflows.
Enterprise cases show that automated accounts payable and media management calculators use benchmark data to compute annual labor reductions and invoice processing savings.
«Enterprise automation calculators use benchmark data to compute annual labor savings and invoice processing cost, justifying ROI before software procurement.»
Dynamic pricing calculators, similarly, use price-elasticity models to estimate optimal price points for complex B2B offerings, tightening margin control during negotiation. Documented savings-calculator patterns run from AP automation models returning cost-per-invoice comparison and payback period, to predictive-maintenance models converting annual gains into first-year ROI multiples, to wellness-program models that discount future savings to present value before computing return.
Quantifying these variables before procurement lets enterprise buyers test vendor claims against empirical performance benchmarks instead of accepting a slide.
Assessment, Comparison, and Lead Capture Calculators
Assessment calculators measure organizational capability maturity against industry benchmarks and generate structured diagnostic reports rather than a single financial figure. Comparison calculators evaluate alternatives side by side, projecting relative cost-benefit performance across competing vendors. Lead-capture tooling then funnels submitted data into a CRM so sales and marketing can act inside existing follow-up workflows.
Lead capture calculators work as interactive lead magnets, exchanging personalized calculation outputs for business contact information. Interactive lead capture formats achieve higher conversion rates than static PDF downloads because they hand the visitor immediate customized utility.
For software selection and developer unit-economics analysis, specialized pricing tools evaluate consumption tiers across technical infrastructure providers. To analyze token consumption and infrastructure pricing models, teams reference detailed guides such as the AI API Cost breakdown.
Build vs Buy: How to Choose
Institutional buyers rarely fail at the math. They fail at the ownership decision. The matrix below compares custom in-house development against enterprise commercial calculator platforms across criteria that matter to CRO, CFO, and model-risk stakeholders.
| Criterion | Custom in-house build | Enterprise commercial platform |
|---|---|---|
| Time to first production version | 8-24 weeks (developer-dependent) | 2-4 weeks; no-code builders compress cycles further |
| Formula transparency & auditability | Full: source formulas and versions owned internally | Partial: depends on vendor documentation and export rights |
| Model-risk validation effort | High upfront, but fully controllable evidence trail | Requires vendor attestation and third-party validation reports |
| GRC / AI inventory integration | Native; endpoint registered directly in internal registry | Requires contractual data-flow mapping and DPA review |
| Provider independence | High: models and data remain portable | Lower: risk of lock-in on scoring logic and hosting |
| Total cost of ownership | Higher build cost, lower marginal cost per calculator | Lower build cost, recurring licensing at scale |
| Maintenance & drift monitoring | Internal MLOps burden | Vendor-managed, but monitoring evidence must still be obtained |
| Best fit | Regulated environments, proprietary scoring logic, high volume of calculators | Fast marketing experiments, single-purpose lead magnets, lean teams |
Reported no-code economics support the "buy" side for non-regulated use cases: platform vendors document development-cycle compression from months to weeks with substantial cost reduction. Regulated financial and healthcare deployments usually justify the in-house path instead, because independent validation, versioning, and audit reproducibility are non-negotiable. One caveat: a hybrid pattern also exists, where the interface is bought and the scoring logic stays in-house behind an internal API. That arrangement keeps the audit trail where examiners expect it.
Which Data to Feed Into AI Media Calculators
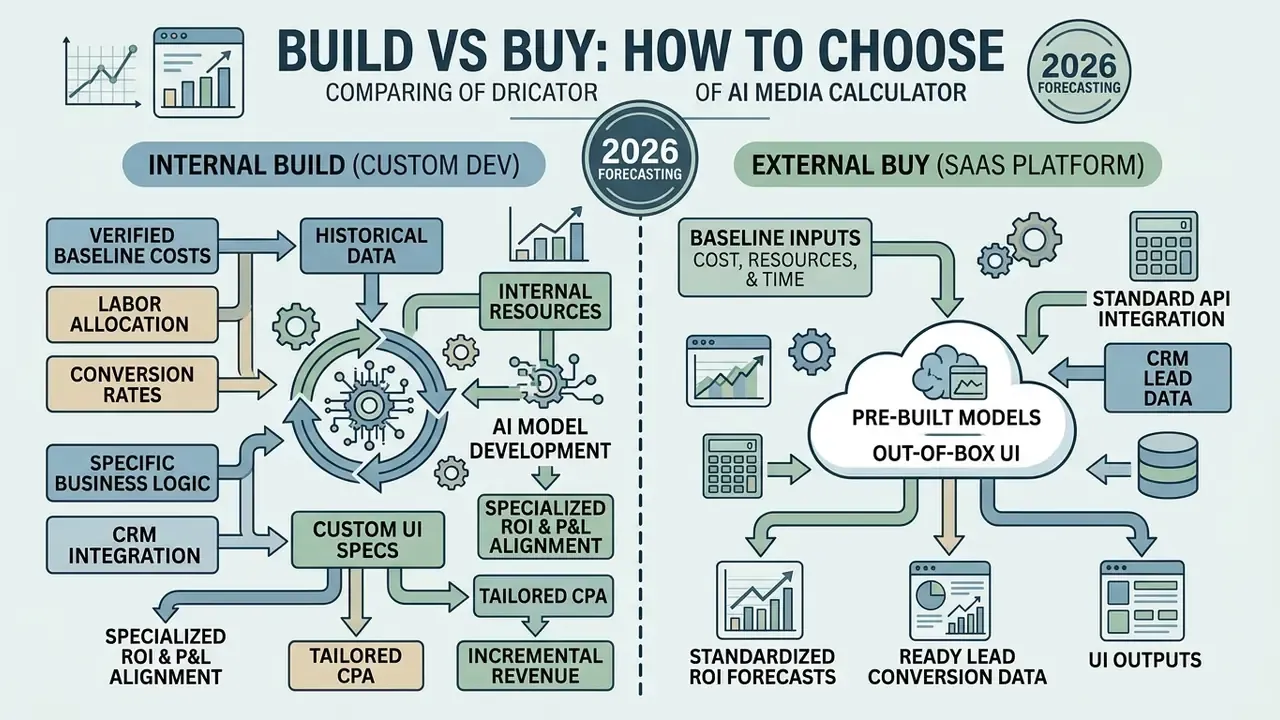
«Verify data against a trusted source, remove impossible or unrealistic values, ensure mandatory fields are populated, and check for missing-data patterns.»
Garbage in, garbage out remains the single largest failure point in media forecasting. Complementary accuracy guidance adds two conditions: training data must be free of sampling bias, and test data must represent the intended purpose of the system.
Marketers also need to separate fixed operational baseline expenses from variable acquisition costs. Structuring inputs into clear categories ensures downstream predictive engines calculate fully loaded acquisition metrics rather than isolated ad-spend ratios.
Baseline Inputs: Cost, Resources, and Time
Baseline inputs represent the financial and human resource floor needed to run marketing programs and process inbound volume. These parameters set the denominator for every subsequent return and payback calculation.
Essential baseline parameters include:
- Direct ad spend allocated per channel and time period.
- Internal labor hours spent by marketing, creative, and analytics staff.
- Hourly labor rates and third-party agency retainers.
- Dedicated software, data infrastructure, and platform licensing fees.
- Total campaign duration and expected sales cycle length.
- Control and governance costs: model validation, legal review, privacy tooling, and monitoring infrastructure.
Cost-estimating standards stress that fully loaded cost structures must incorporate personnel, infrastructure, and material assets to establish a valid investment baseline.
«Fully loaded cost estimates must incorporate personnel, infrastructure, and material assets, with documented assumptions and timing of cost occurrence.»
Leaving out labor or platform costs artificially inflates reported return. Fully loaded CAC extends the same logic to acquisition: paid media spend plus agency, creative, sales and SDR time, tooling, and onboarding, divided by new customers.
Conversion and Lead Quality Data
Conversion and lead quality inputs let predictive algorithms map raw traffic volume to actual business revenue. Feeding historical stage-by-stage conversion metrics into the calculator improves accuracy across the full customer journey.
Required conversion parameters include:
- Landing page click-to-lead conversion rates.
- Lead-to-Marketing Qualified Lead (MQL) transition percentages.
- MQL-to-Sales Qualified Lead (SQL) qualification rates.
- Opportunity-to-closed-won win rates by segment.
- Average deal value, gross margin percentages, and customer lifetime value (LTV).
Machine learning lead qualification frameworks weigh these inputs alongside declarative demographic data and behavioral interaction logs.
«A systematic review classifies lead-scoring models from rule-based and logistic regression to LLM approaches, highlighting the effect of scoring accuracy on sales conversion.»
Calibrating models against real historical funnel conversions prevents speculative revenue projections. Practitioner guidance recommends deriving MQL and SQL thresholds from 12 to 24 months of closed-won and closed-lost outcomes, then backtesting those thresholds before launch rather than adopting vendor default bands. Default bands are convenient. They are also a common reason a "hot" lead grade means nothing to the sales floor.
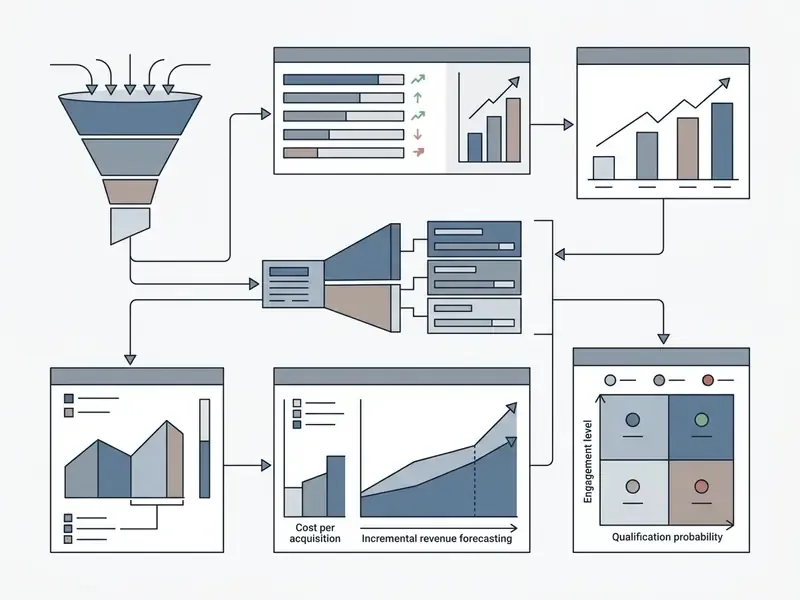
- Form Layout: Standard accessible web interface.
- Input Fields:
- Media Budget ($)
- Team Hours (hrs)
- Hourly Rate ($/hr)
- Historic Conversion Rate (%)
- Target Deal Size ($)
- Output Container: Dynamic
aria-liveblock rendering calculated CPL, Cost Per Qualified Lead (CPQL), fully loaded CPA, and expected ROI. - Fallback: Calculations re-evaluated via server-side logic and rendered natively within plain DOM elements if JavaScript is disabled.

- Supporting Context Line: One sentence explaining what the number means and how it compares to the relevant benchmark band.
- Comparative Visualizer: Dynamic gauge or horizontal bar chart plotting the user's result against an industry benchmark range, with the benchmark source and sample size labeled.
- Trend Visualization: Line or area chart projecting the metric over 12, 24, and 36 months, with conservative / base / aggressive scenario toggles.
- Progressive Disclosure Trigger: Show summary metrics instantly; require a business email only to unlock the full P&L breakdown PDF, itemized quote, or gap-analysis report.
- Contextual Action Engine: Auto-render a dynamic CTA based on score (Score > 80 leads to "Book Executive Demo"; Score 80 or below leads to "Download Optimization Checklist").
- Actionable Insight Block: Render two to four prioritized recommendations derived from the weakest input variables, not just the numeric output.
- Social Proof Slot: Display anonymized average results or benchmark statistics adjacent to the primary metric.
- Mobile Rules: Single-column layout, one question per screen on assessment formats, numeric keypad input types, sticky results summary on scroll.
How the AI Calculator Formula Works
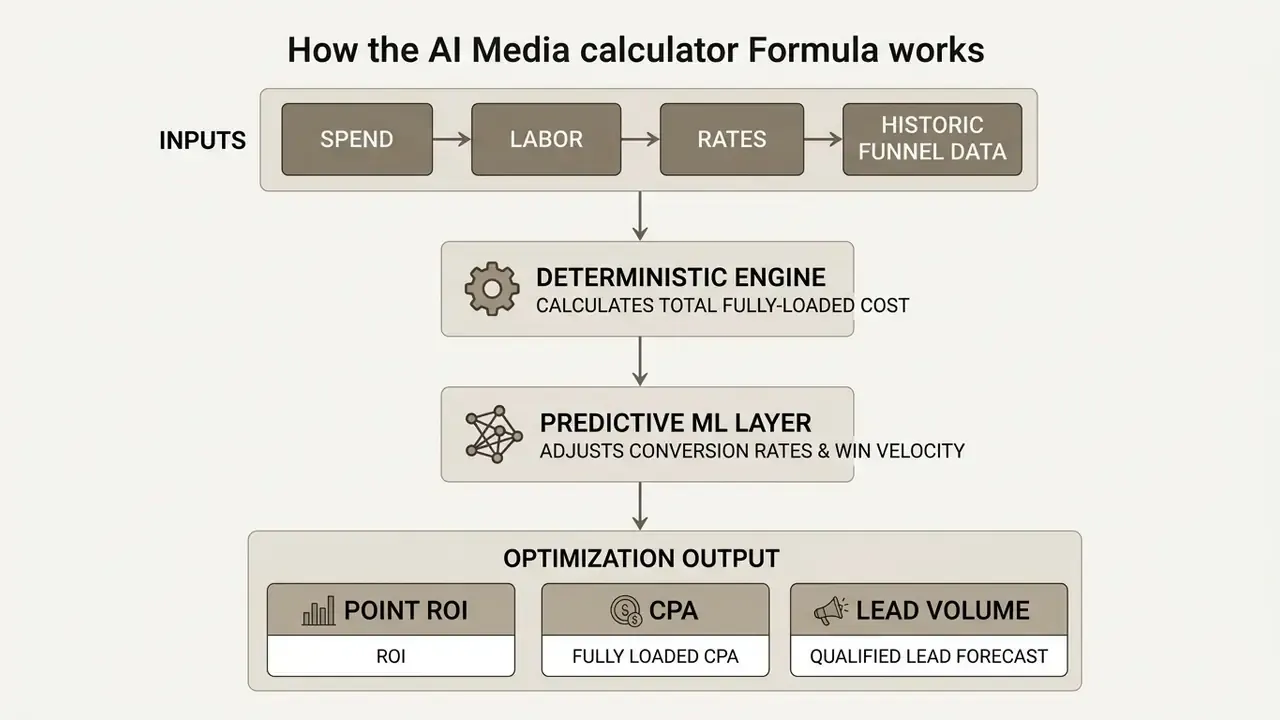
An ai media calculators formula combines deterministic accounting math with probabilistic machine learning inference to convert variable inputs into financial projections. Basic spreadsheet formulas apply strict linear multiplication. AI-enhanced calculators adjust expected outputs using predictive regression models and live data streams.
Deterministic components calculate the absolute metric foundation: total campaign cost, baseline CPL. In parallel, machine learning components evaluate historical performance curves, seasonal shifts, and non-linear audience decay to estimate conversion rates under scaled spending.
Total Campaign Cost = Direct Media Spend + (Labor Hours * Hourly Labor Rate) + Tech Fees

                      + Control & Governance Costs
Risk-Adjusted ROI = [(Predicted Revenue * Gross Margin %) - Total Campaign Cost] / Total Campaign Cost * 100
Updated formula for regulated environments. Institutional ROI hypotheses fail audit when the denominator omits the cost of controlling the model itself. The corrected form adds control expenditure and residual risk:
Institutional Risk-Adjusted ROI =
[ (Predicted Revenue * Gross Margin %) - Expected Residual Risk Cost - Total Loaded Cost ]
/ Total Loaded Cost * 100
where Total Loaded Cost = Media Spend + Labor + Tech Fees
                          + Control & Governance Costs (validation, legal, privacy tooling, monitoring)
and Expected Residual Risk Cost = P(adverse outcome) * Estimated Financial Impact
By decoupling raw campaign volume from final revenue through margin-adjusted math, decision-makers get a realistic view of net profitability. Adding control costs and residual risk removes the classic overstatement, where a model looks profitable only because its governance overhead sits outside the calculation. That single line item has ended more than a few optimistic business cases.
Calculating ROI, Time Savings, and Cost Per Result
True marketing return requires deducting fully loaded operating costs, media spend plus labor overhead plus platform fees, from gross contribution margin. ROI formulas built on ad spend alone overstate profitability by ignoring execution expense.
To quantify productivity payoff, labor time savings convert into money by multiplying saved staff hours by fully loaded hourly compensation.
«Monetize improvement by multiplying unit value by the annual performance change, then subtract program costs before computing ROI.»
If automated AI content tagging cuts campaign setup from 40 hours to 10 hours a month, those 30 recovered hours become real financial value only when redeployed to higher-value work. Formally: ROI = (Benefit − Cost) / Cost × 100, with the benefit-cost ratio BCR = Benefit / Cost used as a secondary sanity check. A small caution here: hours "saved" that simply disappear into slack time are not savings, and auditors will ask.
Cost-per-result calculations must reflect combined expenses divided by final conversion outcomes. Evaluating cost per qualified lead rather than raw cost per click keeps capital pointed at channels that produce viable business prospects.
The Role of AI Models in Forecasting and Personalization
Predictive machine learning models improve accuracy by replacing static assumptions with dynamic variance modeling. Supervised regression algorithms read historical campaign time-series data to forecast conversion fluctuations under shifting market conditions. Similar model classes help teams estimate creative throughput when evaluating AI image generators for high-volume campaign production.
In empirical nowcasting studies, machine learning models using variable shrinkage and ensemble weighting achieved up to 60% higher predictive precision than classical linear models.
«A mixed-frequency machine-learning structure with LASSO-based variable selection produced predictive gains of up to 60% in real-time nowcasting.»
Ensemble methods also reweight sub-models based on recent performance, which stabilizes predictions during rapid market shifts.
Large language models extend the capability further by extracting intent signals from unstructured CRM interaction logs.
«The LLM-based HPRO framework reached AUC 0.8161 and improved top-tier lead precision by 39.7%; a 132-day A/B test showed 9.5% sales growth.»
Integrating unstructured communication records into predictive lead ranking therefore improves top-tier qualification precision by nearly 40%, with the AUC and A/B-test figures above serving as the specific empirical basis for that claim.



How to Read AI Media Calculator Results
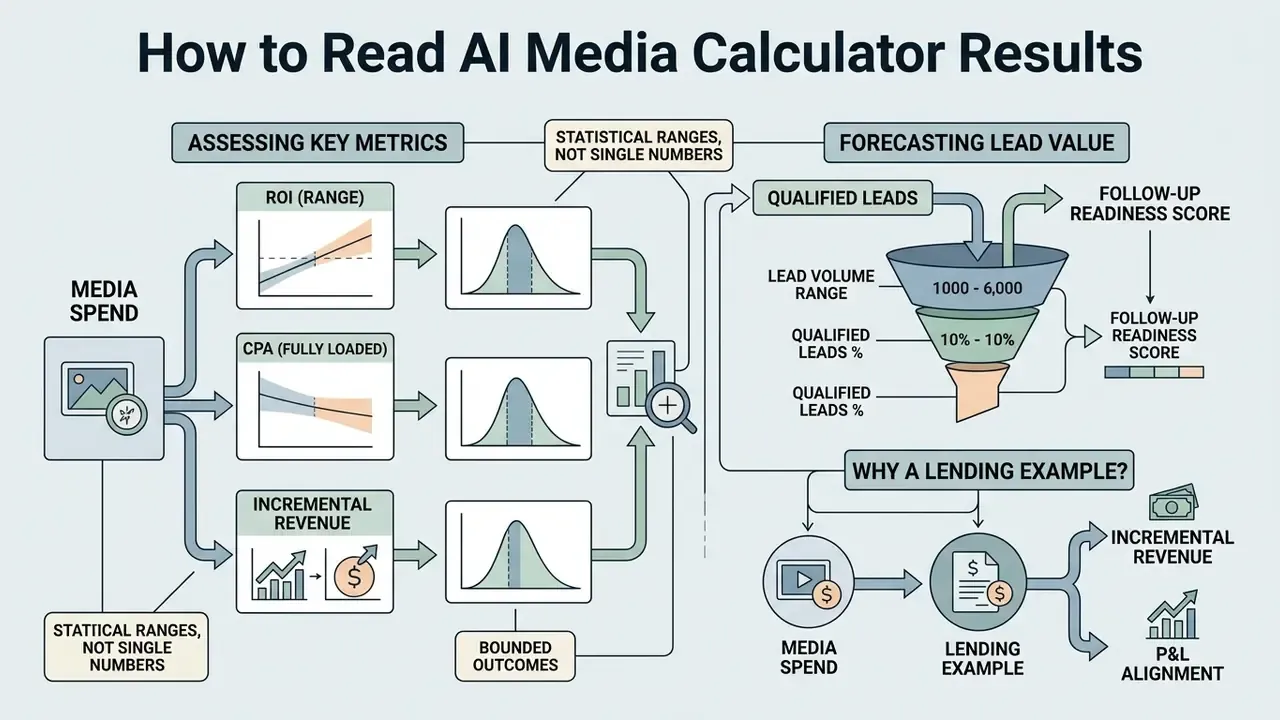
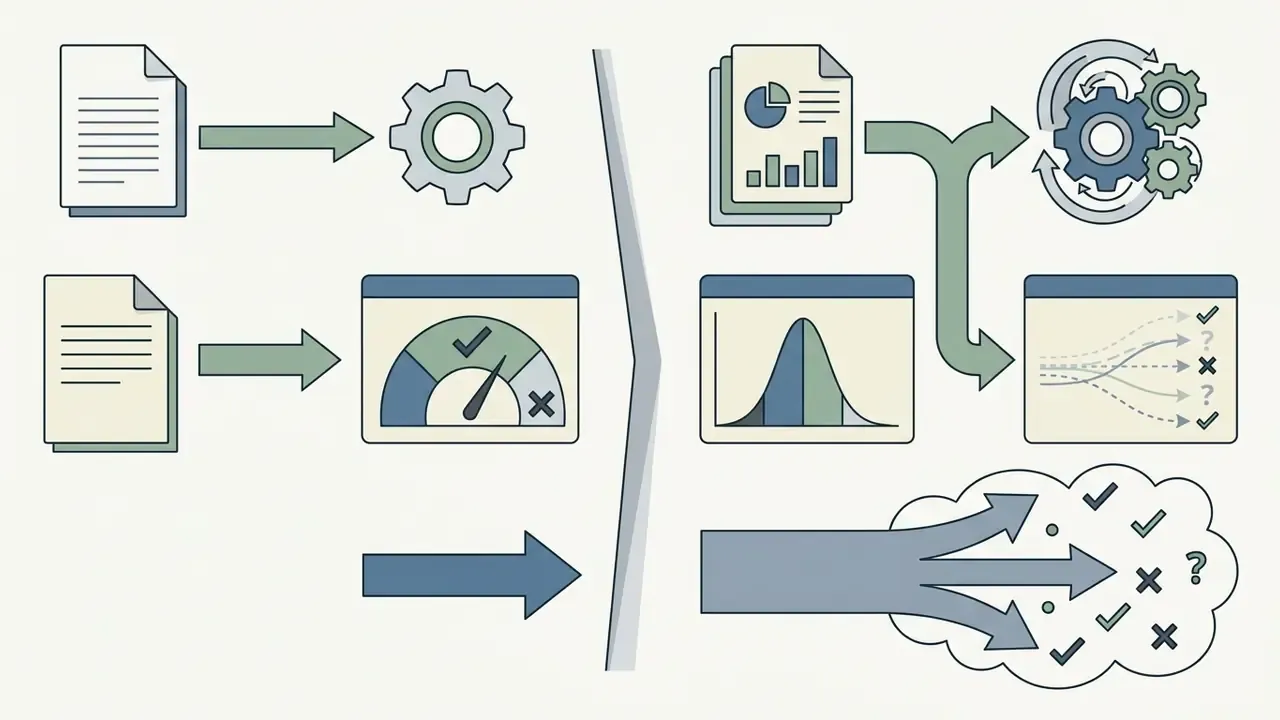
Interpreting ai media calculators results means reading output values as bounded statistical ranges, not single deterministic outcomes. Decision-makers should analyze key performance metrics alongside explicit confidence intervals to judge whether projected returns fit institutional risk tolerance.
Standard displays output point estimates for total spend, CPA, qualified lead volume, and projected ROI. Sound financial governance, though, dictates evaluating scenario distributions, conservative, base, and aggressive, before approving any media budget reallocation.
Isolating performance variation across individual channels prevents over-investing in underperforming placements. Reading unit metrics next to absolute volume keeps channel expansion from quietly destroying margin.
Assessing ROI, Cost Per, and Potential Value
Evaluating ROI and unit cost metrics establishes whether a proposed campaign clears enterprise payback guidelines. The metrics need a clear hierarchy: efficiency, margin contribution, then total revenue impact.
| Performance Metric | Calculation Formula | Strategic Interpretation |
|---|---|---|
| Fully Loaded CPA | Total Expenses / Total Acquisitions | Indicates true cost to acquire a paying customer, including labor and tech. |
| Cost Per Qualified Lead (CPQL) | Total Expenses / Qualified Leads | Reflects demand generation efficiency; superior to raw CPL for pipeline health. |
| Marginal ROI | (Incremental Revenue * Margin - Incremental Cost) / Incremental Cost | Identifies the point of diminishing returns across scaling media channels. |
| Incremental Revenue Share | Incremental Revenue / Total Attributed Revenue | Separates genuinely additive growth from harvested existing demand. |
| LTV:CAC Ratio | Margin-based LTV / Fully Loaded CAC | Tests whether unit economics support sustained scaling. |
| Time Payback Period | Implementation Cost / Monthly Labor Savings | Quantifies months required to recover internal software or automation investment. |
Reading these together prevents familiar planning errors, such as scaling spend on low-margin products that generate impressive lead volume and negative net profit. Optimization guidance is consistent across sources: optimize toward cost per qualified lead and LTV:CAC, not toward raw CPL or the lowest unit cost per touchpoint.
Forecasting Qualified Leads and Follow-Up Readiness
Lead volume projections are only actionable when categorized by qualification stage and sales-readiness threshold. High raw lead estimates often hide poor qualification rates, and the result is a sales team buried in unvetted contacts.
Recent commercial implementations use predictive scoring frameworks that combine demographic fit with engagement velocity.
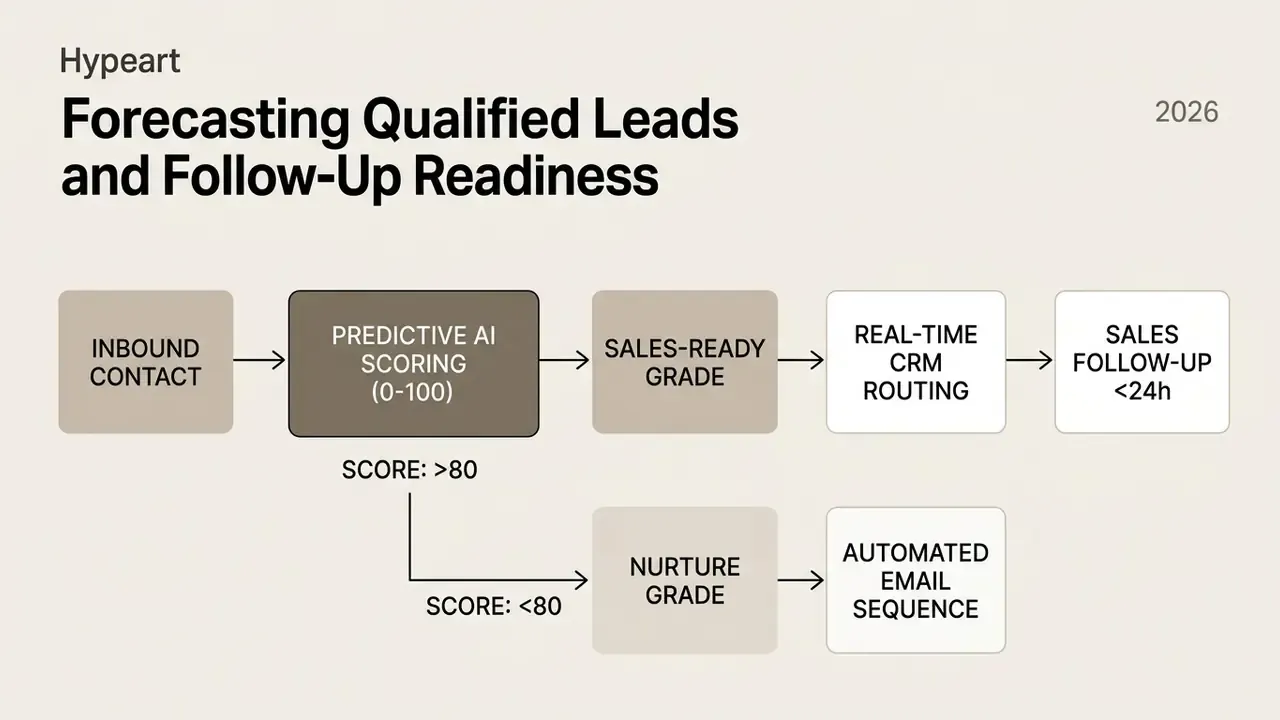
«Leads are scored 0-100 across seven signals and classified as Cold, Warm, Hot, or Sales-ready, with high scorers routed for contact within 24 hours.»
Leads above predefined statistical thresholds route automatically to senior account executives for follow-up within 24 hours, while BANT-style checks (budget, authority, need, timeline) gate the final handoff.
How to Integrate an AI Calculator Into the Marketing Stack
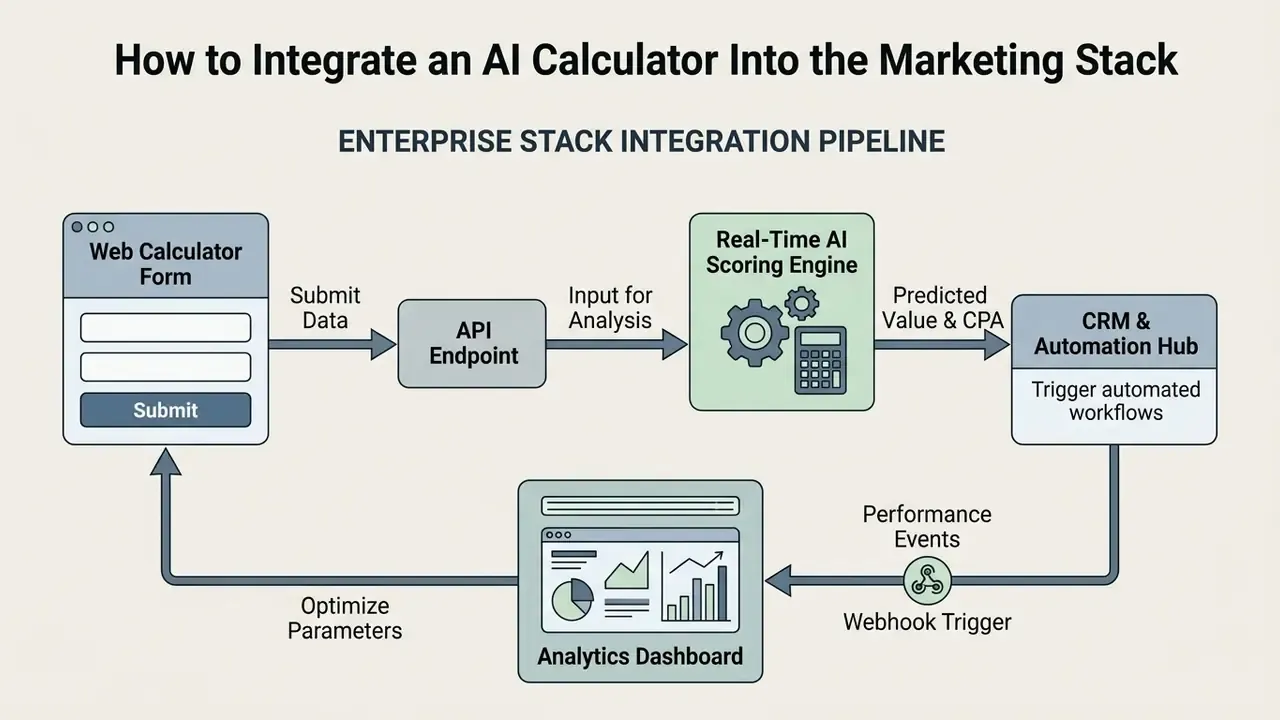
Integrating an AI calculator into an enterprise marketing stack requires automated data pipelines between web interfaces, CRM platforms, and analytics engines. Siloed calculators that live apart from central records create data friction and stall sales follow-up.
Modern integration architecture relies on event-driven webhooks and API endpoints streaming calculator inputs and output scores into central customer data platforms (CDPs) in real time. The same discipline applies when embedding text-to-video AI tools into campaign production pipelines.
The documented rollout sequence across CRM-AI implementation guidance is remarkably consistent: unify and cleanse CRM data first, define measurable business goals with executive ownership, pilot in small scoped deployments, then extend governance and monitoring to outputs and analytics. Integration failures correlate with siloed data and weak stakeholder alignment far more than with algorithm choice.
CRM Integration, Lead Scoring, and Email Marketing
Streaming calculator data straight into the CRM makes lead scores, input parameters, and ROI projections visible to sales reps immediately. Platform documentation indicates that machine-learning lead scoring models need structured historical conversion records, typically a minimum of 50 converted and non-converted contacts, to calibrate accurately.
«The AI score requires at least 50 contacts, including 25 converted and 25 non-converted, to build the model.»
Analytics and Continuous Optimization After Launch
Post-launch management requires continuous monitoring of calculator predictions against observed campaign outcomes. Algorithmic outputs drift as market conditions, media costs, and customer behavior evolve.
AI governance standards call for continuous post-deployment monitoring covering model functionality, drift indicators, and predictive accuracy.
Engineering teams assess real-world performance through structured evaluation workflows: operational metrics, continuous evaluation of production traffic at a sampled rate, scheduled evaluation against a fixed test set for drift, alerting when outputs breach quality thresholds, plus output-distribution comparison with univariate and multivariate drift detection.
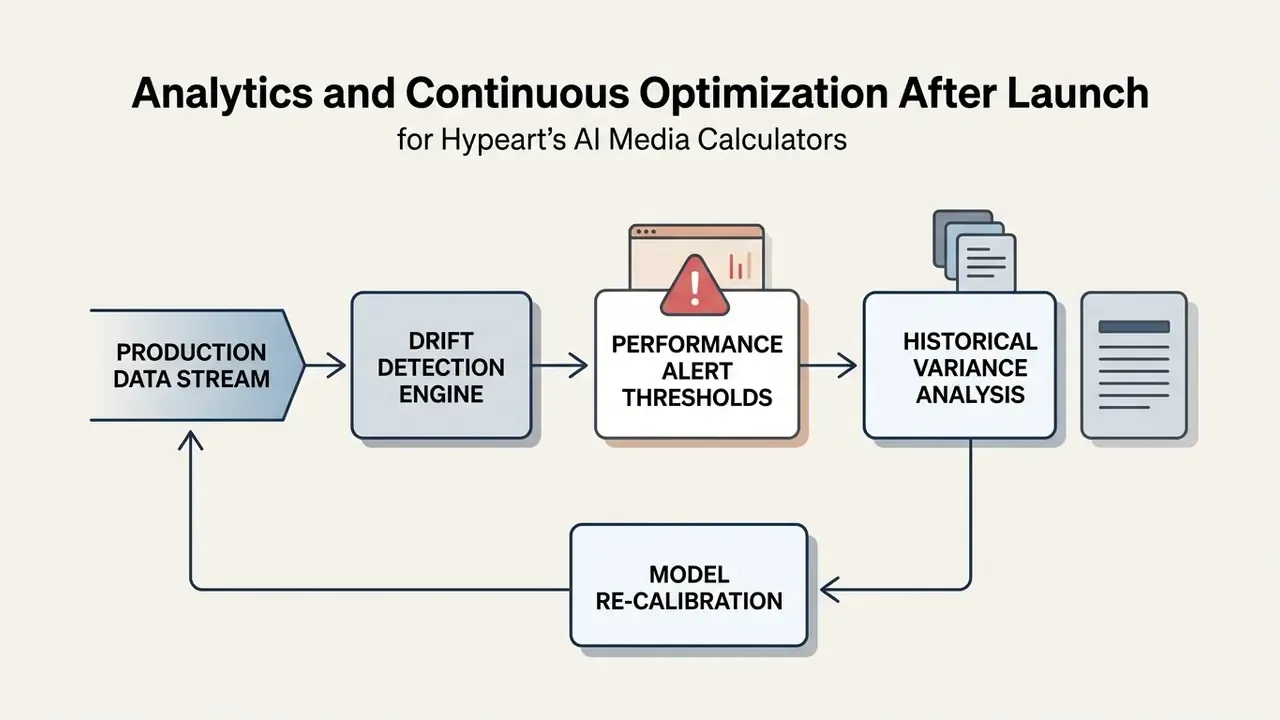
Retraining on fresh production data prevents accuracy decay and keeps forecasts aligned with actual sales results.
Model Risk Management: Validation, Audit, and Audit Trail
For banks, insurers, and fintech lenders, a calculator that influences spend or customer treatment sits inside the model-risk perimeter. The checklist below mirrors expectations from classic supervisory model-risk guidance (SR 11-7, OCC) and the NIST AI RMF:
- Conceptual soundness review. Document the theory behind each formula, the deterministic and probabilistic split, and why the chosen algorithm suits the business question.
- Independent validation. Validation performed by a function organizationally separate from the team that built the calculator, with documented challenge of assumptions.
- Assumption inventory. Every assumption (margin, sales cycle, qualification rate, seasonality) logged with owner, source, and review date.
- Data lineage evidence. Traceable path from source system to input field, including transformations, exclusions, and outlier rules.
- Benchmarking and outcomes analysis. Periodic back-testing of forecast against realized results, with error metrics tracked over time.
- Sensitivity and stress testing. Behavior under extreme inputs (zero conversion, 10x spend, margin collapse) documented; guardrails block nonsensical outputs.
- Drift and stability monitoring. Thresholds, alert owners, and escalation path defined before go-live.
- Model versioning and audit trail. Every algorithm version, feature set, and configuration change logged with timestamps in a model registry (for example, an MLflow-style registry), so any historical prediction can be reproduced exactly during a regulatory examination.
- Human-in-the-loop control. Named approver for decisions above defined materiality thresholds; overrides logged with rationale.
- Periodic revalidation. Scheduled re-review cadence, plus event-driven revalidation after material market or platform changes.
Where estimates appear in reported results, measurement standards require the estimate to be disclosed and empirically supported, along with assumptions, sample bases, and error terms. That is the same discipline that keeps calculator outputs auditable rather than promotional.
How to Protect Data Without Eroding Trust in the Calculator
Enterprise calculators must hold to strict data minimization to keep user trust and satisfy regulators. Privacy risk here is quantifiable: it scales with the likelihood of a problematic data action multiplied by its impact, so over-collection raises both terms at once.
Exposing formula assumptions and protecting submitted data supports compliance with global privacy regulation while lifting completion rates. The two goals are not in conflict, which surprises people.
Transparency of Formula, Data, and Results
Algorithm transparency means disclosing how calculations run, which data parameters feed them, and where predictive uncertainty lives. Clear formula explanations blunt "black box" skepticism among enterprise buyers.
Governance guidelines from the European Commission stress that users must be informed when they interact with automated AI systems, and that machine-readable markers must identify synthetic outputs.
Practical transparency mechanisms include:
- Displaying explicit formula notes beneath output figures.
- Highlighting which variables represent historical facts versus statistical forecasts.
- Documenting data source origin, sample sizes, and calibration dates.
- Stating model limitations and specific domain applicability limits.
- Publishing the last model-revalidation date next to the results container.
Visible methodology controls reassure risk-averse executives that outputs represent sound engineering estimation rather than an arbitrary marketing claim. Explainability, in this framing, means traceable technical processes and human decisions that a non-specialist can actually follow.
Lead Capture Mistakes: Asking Too Early, Following Up Too Late
Demanding business contact details before demonstrating value remains a primary cause of form abandonment. User experience research and current form-design guidance agree: top-of-funnel lead forms should minimize initial friction and deliver interactive value before requesting data.
«Top-of-funnel forms should start with three to five fields, ask one question at a time, and make the value exchange explicit before submission.»
Complementary form-architecture guidance recommends a hook, then qualification, then handoff sequence, with micro-commitments and a visible value exchange, placing qualification after the initial hook rather than before it.
Effective lead capture design follows a progressive disclosure sequence:
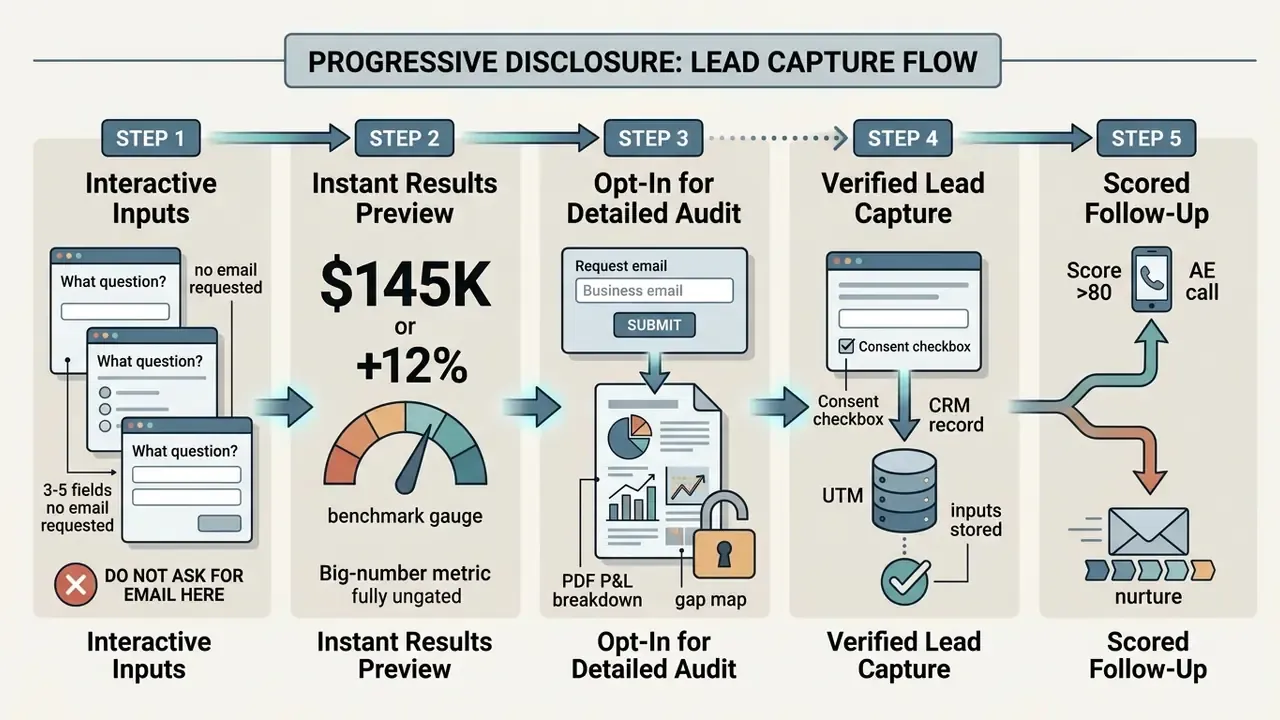
Requesting contact information only when you deliver high-value extended output, such as a downloadable PDF audit or a customized strategy report, preserves trust while capturing genuinely qualified prospects. Two additional patterns work well: value-added reports (comparison charts, implementation guides) exchanged for contact details, and save-and-return links emailed to users whose calculators require internal research to complete accurately.
And the second half of the mistake matters just as much. A perfectly designed capture flow with a five-day follow-up delay converts like a broken one.
Fair Lending, FCRA, and Algorithmic Bias in Financial Calculators
Calculators that score credit-adjacent inquiries carry obligations well beyond privacy. Where an AI score influences the terms, priority, or availability of a financial product, fair-lending and consumer-reporting frameworks (including FCRA-type adverse-action and accuracy requirements in the United States) may apply. Proxy variables such as ZIP code, device type, or behavioral timing can produce disparate outcomes even when protected attributes are excluded from the feature set.
Controls to document before launch:
- Disparate-impact testing across protected classes on model outputs, not only inputs.
- An explicit exclusion list of prohibited and proxy features, reviewed by compliance.
- Clear separation between a marketing calculator (informational estimate, no eligibility decision) and an underwriting model (regulated decisioning), stated plainly in the on-page copy.

- Data Minimization: Do not collect sensitive financial, health, or unencrypted personal data within public-facing calculator forms.
- Uncertainty Disclosure: Automated projections generated by AI calculators represent statistical estimates based on historical inputs. Actual campaign outcomes will vary with market conditions and execution context.
- Explicit Consent: Ensure lead capture forms include clear opt-in checkboxes for communications in compliance with regional privacy frameworks (GDPR, CCPA).
- No Eligibility Decisions: Public calculators must state that results are illustrative and do not constitute an offer, a credit decision, or professional advice.
- Retention Limits: Define and publish how long calculator inputs are stored and when they are deleted or anonymized.
FAQ on AI Media Calculators
Can you build an AI calculator without code?
Yes. Modern visual app platforms and specialized calculator builders let non-technical teams assemble interactive AI calculators without writing custom code. Options available through 2026 generate calculator logic, layout templates, and input forms directly from natural language prompts.
«Describe the calculator in plain language and the builder drafts formulas, inputs, and layout, then outputs embeddable HTML/JS.» - Calculator.Design and comparable prompt-driven calculator builders (2026). https://calculator.design
These no-code environments ship pre-built mathematical modules, drag-and-drop form components, and API connectors. Teams can connect visual layouts to external AI scoring models through no-code automation platforms, which enables rapid prototyping without dedicated development resources. Reported advantages include visual formula builders, proven templates, brand-matched drag-and-drop design, native CRM, email, and analytics integrations, and automatic responsive behavior for mobile traffic, plus iteration in minutes instead of development tickets.
Enterprise implementations still need data governance oversight, so the underlying formulas, privacy controls, and CRM workflows meet corporate security standards. In regulated environments, a no-code calculator still needs an owner, a validation record, and an entry in the AI systems inventory. No exceptions worth defending.
Why is a calculator result an estimate rather than a final decision?
Calculator outputs are statistical estimates because they rest on historical assumptions, mathematical approximation, and probabilistic machine learning. Official government AI implementation standards define automated model outputs explicitly as informed guesses rather than immutable facts.
«AI outputs should be treated as a statistically informed guess, not factual information, with the data source and inference method documented.» - UK Government Artificial Intelligence Playbook (2025). https://www.gov.uk
External commercial variables, competitor bidding shifts, advertising platform algorithm updates, macroeconomic movement, and sales execution variance, cannot be fully predicted from baseline historical data. So calculator outputs work as directional decision-support inside a broader strategic evaluation, not as a verdict.
Decision-makers should validate forecasts through controlled market testing, periodic sensitivity analysis, and continuous performance auditing.
For media teams evaluating compute costs, generation tiers, and platform usage credits across creative AI tools, specialized utilities such as the AI Video Credit Calculator provide a clearer framework comparison.
How does attribution differ from a probabilistic forecast in an AI calculator?
Attribution is retrospective accounting. It distributes credit for outcomes that already happened across touchpoints that already occurred, using observed logs and a defined credit rule (last click, position-based, data-driven). It answers: which touchpoints were present on paths that converted?
A probabilistic forecast is prospective inference. It estimates outcomes that have not happened yet by fitting a model to historical distributions, then projecting under stated assumptions. It answers: what range of results should we expect if we spend this way?
Three practical consequences:
- Attribution cannot prove incrementality. Two channels can both receive attributed credit while only one produced genuinely additive revenue. MMM and incrementality testing exist to separate them.
- Forecasts carry uncertainty; attribution carries measurement bias. A forecast must be reported as an interval. Attribution must be reported with its credit rule and tracking limitations disclosed.
- They serve different moments. Attribution reconciles last quarter; the probabilistic layer sizes next quarter. A well-built AI media calculator shows both side by side and never presents a forecast as if it were a measured result.
How much historical data does a calculator need for reliable scoring?
Platform documentation commonly sets a hard floor near 50 labeled contacts (roughly 25 converted, 25 non-converted) simply to train a model at all. That is a technical minimum, not a reliability threshold. For threshold setting, practitioner guidance recommends 12 to 24 months of closed-won and closed-lost outcomes, so MQL and SQL cutoffs derive from actual conversion behavior and get backtested before launch. Below that volume, use deterministic rules and publish the model as directional only.
Who should own a public marketing calculator in a bank?
Ownership usually splits three ways, and ambiguity there is the real risk. Marketing owns the experience, the copy, and the conversion targets. A named model owner, often in analytics or data science, owns the formula, the feature set, and the retraining cadence. Model risk or compliance owns validation, disparate-impact testing, and the disclosure language.
Escalation path matters as much as ownership. Define in advance who can pause the endpoint, who signs off on a formula change, and what materiality threshold forces a full revalidation instead of a lightweight review. Write it down before launch, because after an incident nobody agrees on what was implied.
Implementation Checklist for an AI Media Calculator
Use this as the final gate before publishing a calculator that influences spend or customer treatment.
Checklist0 / 22
Ownership and Escalation Matrix
| Activity | Accountable | Consulted | Evidence produced |
|---|---|---|---|
| Business case and KPI definition | Business sponsor (CMO, CRO, or CFO) | Finance, model risk | Approved objectives memo with materiality thresholds |
| Formula design and feature selection | Named model owner | Analytics, compliance | Documented assumption inventory and data lineage map |
| Independent validation | Model risk / validation function | Internal audit | Validation report with challenge log and findings |
| Privacy and consent design | Privacy office | Legal, marketing ops | DPIA or equivalent assessment, retention schedule |
| Fair-lending and bias testing | Compliance | Model risk, data science | Disparate-impact test results, exclusion feature list |
| Post-launch monitoring | MLOps / platform team | Model owner | Drift dashboards, alert log, retraining records |
| Pause or rollback decision | Model owner with sponsor sign-off | Compliance | Timestamped decision record with rationale |
Keep this matrix in the same repository as the model registry entry. When an examiner asks who approved a change, the answer should take one minute to produce, not one week.
Appendix A: Source Correction Log
Retained for editorial transparency and audit reproducibility. Earlier published versions of this article cited the references below, which have since been corrected in the body text.
| Previous citation | Issue identified | Current citation (updated) |
|---|---|---|
| "Artificial Intelligence Decision Support Review, 2025" | Publication not verifiable; URL resolved to a publisher homepage without DOI | Peer-reviewed study on multi-channel advertising budget allocation using Q-learning and ML-ABC (2025), with methodology described in text |
| "SalesLoop Research, 2026" | Preprint identifier absent | SalesLoop framework study, industrial preprint (2026), with training volume and NDCG@K / P@K metrics stated |
| "Australian Government AI Data Guidance, 2026" | Forward-dated reference | Australian Voluntary AI Safety Standard / Australian Government AI data-quality guidance (2024) |
| "NIST Special Publication 800-4, 2025" | SP 800-4 is a superseded 1992 computer-security document, not an AI standard | NIST AI Risk Management Framework (AI RMF 1.0, AI 100-1) and associated post-deployment monitoring guidance |
| "FTC Lead Marketing Review, 2026" | Forward-dated reference | FTC business guidance and research on data collection, brokerage, and spam in lead marketing (2023-2024) |
| "U.S. GAO Cost Estimating Guide, 2020" | Accurate; document number omitted | U.S. GAO Cost Estimating and Assessment Guide, GAO-20-195G (2020) |
| "HPRO Framework Study, 2025" (no metrics) | Claim of roughly 40% precision gain lacked attribution | HPRO framework study, preprint (2025): AUC 0.8161, +39.7% top-tier precision, +9.5% sales in a 132-day A/B test |